Share this story
- As school letter grades are released, @MichaelMaherPhD @ncpublicschools said "we are seeing lower rates of proficiency due to the pandemic." He asks for schools designated as low performing not to be called low performing schools. #nced
- “For anyone who seeks to criticize educators based on the release of this data, you are wrong,” said Alan Duncan @edstateboard_nc, adding that educators are first responders and professionals. “We should be lifting them up for that because that's what they are.” #nced
Historically, the criticism when the state released school performance data centered on disparities for students of color, students living in economic disadvantage, and students with disabilities under the current school accountability model.
When Department of Public Instruction (DPI) officials presented the data on Thursday, however, the concern was collectively for the state because performance on tests dropped for so many students across racial, economic, and learning differences.
“In some respects, this might provide an education to students and their families who have not historically struggled,” State Board of Education Vice-Chair Alan Duncan said. “They’ve been presented with some struggles that are very unfamiliar for them, but are quite familiar for students who have greater challenges.”
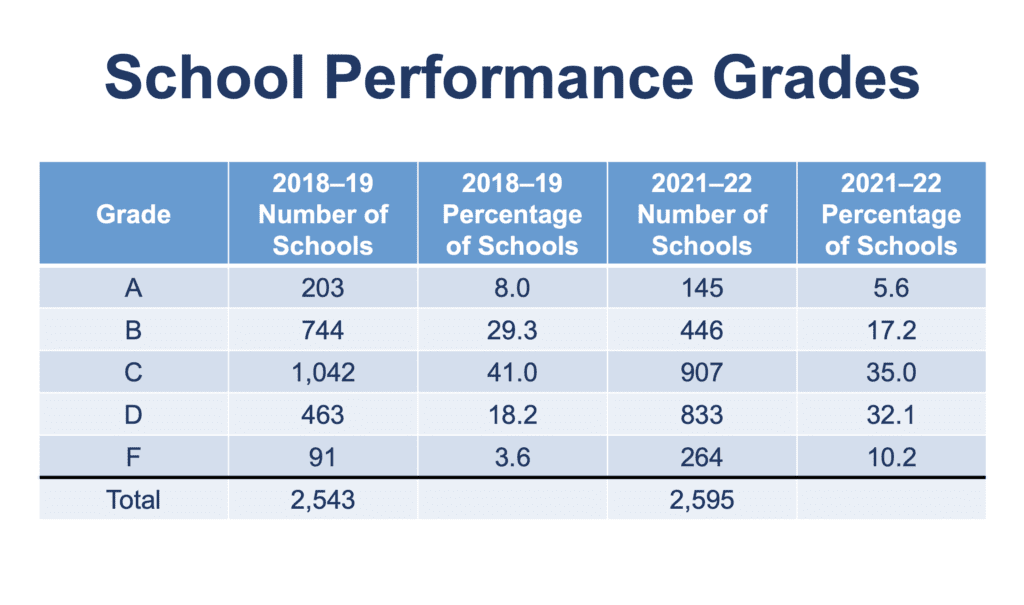
In its presentation to the State Board, DPI officials said proficiency declined in 2021-22 compared to the last pre-pandemic school year, but also that schools made gains compared to 2020-21 (the first full year with pandemic challenges). The accountability model identifies 1,097 out of 2,595 schools as “D” or “F” schools. That’s an increase of 543 schools from 2018-19.
The accountability model, which the General Assembly passed in 2013, figures school grades by putting 80% weight on standardized test scores and 20% on whether student performance grew relative to expectations. The law labels schools with “D” or “F” grades that either met or did not meet growth expectations as low-performing: 864 schools now carry a low performing designation, up by 376 from 2018-19.
“I will ask that no one else refer to these schools as low performing schools — they are schools designated as low performing,” Deputy State Superintendent Michael Maher said while co-presenting the data. “Why does that matter? Because they are designated based on a formula that prioritizes proficiency and we are seeing lower rates of proficiency due to the pandemic.
“It is not an accurate reflection of the efforts and progress of teachers and school leaders throughout this state.”
What they’re saying about the accountability model
State Superintendent of Public Instruction Catherine Truitt has been critical of the accountability model, including in her recent testimony before the House Select Committee on An Education System for North Carolina’s Future.
“We need to redefine school accountability and rethink what student testing looks like,” she told the committee.
On Thursday, others joined in the call for change.
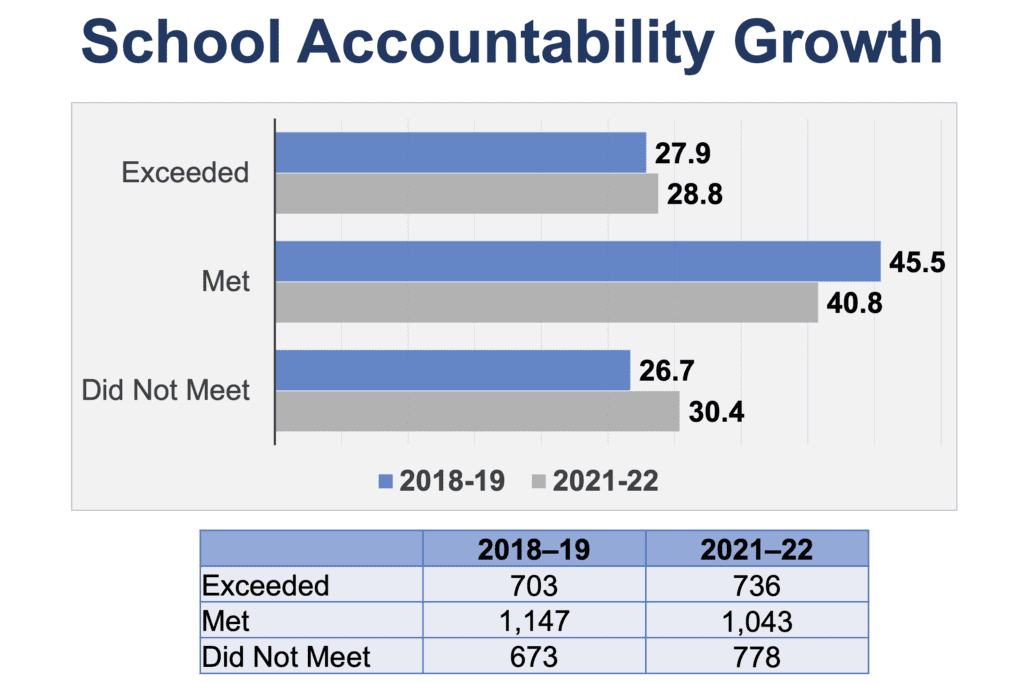
“I think we’re all hard pressed to find professionals in the education field at this point who believe that growth is not more important than proficiency,” Duncan said, thanking Truitt for leading efforts to change the model. “Growth is what moves our students forward.”
Duncan noted that prior to the pandemic, about 75% of schools met or exceeded growth. The data released Thursday shows about 70% of schools meeting or exceeding growth, he said.
Olivia Oxendine was the lone member of the Board that spoke up in favor of the current model.
“I happen to be in that small minority of educators in North Carolina who believes that the 80/20 is not all that bad,” she said, saying that the ratios could be tested to determine if they should change. “And here’s the reason … I feel if if we start lowering proficiency, we may not get growth or the growth may be negatively impacted.”
Maher said the idea of revisiting the accountability model is not to discourage proficiency, but rather to assess students as whole people instead of as the result of one test.
“So far, what we’ve done is we’ve conflated this idea that school performance is all about that proficiency rate without taking into consideration all of the other things that happened in the school,” he said. “We are not interested in lowering proficiency rates. I think we are interested in a more comprehensive view of the value of not only public education but of a particular school.”
Edgecombe County Public Schools Superintendent Valerie Bridges used reading scores as an example. For the last several years, the state has referred to 57% third-grade reading proficiency to underscore the urgency for implementing the science of reading law passed last year. That proficiency rate is now 46.4% (up from 45.1% in 2020-21).
“That’s not a shock,” she said. “We knew that was coming, [but] look at all that we’re already doing to address that.”
Does the accountability model serve its purpose?
The current model misses that value Maher referred to, Duncan said. He worries that the model simply sets teachers up for criticism every year. After presentation of the data, he made a plea from the Board table.
“For anyone who seeks to criticize educators based on the release of this data, you are wrong,” he said, adding that educators are first responders and professionals. “We should be lifting them up for that because that’s what they are.”
Two superintendents in the room on Thursday echoed Duncan’s sentiments. They also added that proficiency on standardized tests is just one of many things district leaders rely upon to guide local decision-making.
“It’s after-the-fact data, it happened in the past,” said Eisa Cox, superintendent of Ashe County Schools. “I think that we have to be forward-thinking and really focused on what’s happening day-to-day. Growth is happening for our children and we have to recognize that not every school starts in the same place, not every child starts in the same place.”
Cox said when she looks at the broader picture, it doesn’t look so bleak in her district. In Ashe County, 90% of schools met or exceeded growth, 22 seniors graduated with both high school diplomas and associates degrees, students earned 707 industry credentials, as well as awards for forestry, culinary arts, early childhood and more.
“The list is long and includes many successes both school-wide and at the individual level surrounding the education, health, and well-being of our children that can never be defined by a test score or letter grade,” she said.
Criticism of the accountability model is not new
When legislators debated the school performance grades prior to enactment, some senators argued that growth should be a bigger factor in the formula. Sen. Gladys Robinson worried that students would leave traditional public schools based on the grades.
“It comes down to choice,” Senate President Pro Tem Phil Berger said at the time.
Since he spoke those words, the number of charter schools has grown from 107 in 2013 to 203 now. During that same period, the amount of state funding for opportunity scholarships — which are vouchers qualifying families can use to attend private schools — has grown from about $50 million to about $95 million last year. Next year, the General Assembly has raised it to $120 million.
But what is choice rooted in when it’s based on school performance grades?
Shortly after the legislation went into effect with the 2013-14 school year, a Duke professor tracked the school performance grades and found that grades were inversely related to poverty. Last year, the North Carolina Justice Center, a progressive think tank, reexamined the data and found the same relationship, as well as a similar correlation with race.
So while many are pointing out that the school performance grades shouldn’t be viewed apart from the other good things happening as students recover from the pandemic, Bridges said it can’t be viewed apart from the challenges students face, either.
Those challenges include the pandemic, but also other factors like food or housing insecurity, the loss of loved ones, and the circumstances of parents that could impact schooling support at home.
Bridges wore a walking boot on her right foot as she sat for the interview. Pointing to it, she asked, “If I’m racing someone and I lose, and you tell everyone I lost but you don’t mention I have the boot on me, what does that do to me?”
That’s the stigma of using proficiency metrics so heavily while leaving out factors beyond the control of students and schools, she said. And 78% of respondents to a 2019 survey by EdNC agree. Ninety percent of participants said a school’s performance grade should include metrics beyond just student achievement and student growth.
Just yesterday, during oral arguments before the state Supreme Court in the Leandro case, an attorney for Berger and House Speaker Tim Moore argued that standardized test data was insufficient to say students aren’t receiving a sound basic education because it ignores conditions on the ground and a holistic review.
“Everybody’s told us … that these metrics, the formula, it’s not good,” State Board member James Ford said. “So what’s the purpose then of using the formula? If we don’t believe it’s fair, if we don’t believe it’s equitable, what is the virtue and the value of using it?”
The data focuses on student and school goals, but what about the State Board’s goals?
While the pandemic has resulted in more students showing up as not proficient and more schools showing up with a low-performing designation, Bridges says it’s not quite accurate to say more people are now in the same boat. Students and communities that were on track before the pandemic, she said, will likely recover from the pandemic’s effects quicker than those with pre-existing challenges.
“They rebound quicker,” Bridges said. “They’re more resilient”
Indeed, there are disparities even though numbers are down across the board. For example, more than 70% of white and Asian students tested proficient in reading while that number was 32% for Black students and 35.5% for Latinx students. In math, 82% of Asian third through eighth grade students tested at proficiency compared to 64% of white students, 40% of Latinx students and 30% of Black students.
The persistent disparities combined with statewide challenges places continued importance, Bridges said, on the State Board’s strategic plan, which was adopted just before the pandemic and centers both equity and the whole child.
Ford, who was co-chair of the strategic planning committee when the plan was adopted, said it’s critical to look to that plan now.
“If anything, it reinforces the sense of urgency around each of those goals,” he said. “And the objectives. I’ll challenge anybody to go look at our strategic plan. And look at all those items and tell me which one of those would need to be modified or removed, omitted, edited as a result of the data you just saw.”
Editor’s Notes:
Here is the press release.
Here is the background brief.
Here is the communication webinar.
Here is the report.
The testing results are available in a new database where you can see data by state, district, region, and school.
Here is a report on 50-State Comparison: States’ School Accountability Systems by Education Commission of the States so you can see how other states think about accountability.
EdNC will be releasing our maps of school letter grades later this fall so you can adjust the formula based on your values and see the impact on the school grades. We created the mapping tool to build awareness about how public policy choices — like the 80%, 20% formula — impact the perception of schools.