In his autobiography published nearly a century ago, Mark Twain popularized a wisecrack about data. “There are three kinds of lies,” he wrote, “lies, damned lies, and statistics.” Seven decades later, Harvard business professor Michael Wheeler gave that barb another spin with his book titled, “Lies, Damned Lies, and Statistics: The Manipulation of Public Opinion in America.”
American public life, to be sure, is perhaps more than ever awash in data that drive decision making — in politics, health, environment, economics, and education. The accountability movement that arose in the late 20th Century intensified the influence of statistics, especially drawn from standardized tests, in public school policy and in classroom practices.
Of course, complex enterprises such as pre-K-12 schooling need data to highlight best practices, to confront shortcomings, and to cast light on inequities. The challenges are to avoid over-simplification and to balance dry data with observation and storytelling.
As an exercise in better use of data, for example, it’s important that state education authorities revise the flawed, simplistic grading of schools on an A-to-F scale. Meanwhile, the absence of data requirements from private schools benefitting from voucher funding leaves the state without adequate assessment of their educational performance.
While bearing in mind the caution implicit in Twain’s wisecrack, let’s turn attention to some statistical analyses that lend perspective to the tax-and-spending choices being made in the General Assembly. With details still under negotiations, the Republican majority has followed a framework that combines further personal and corporate income tax reductions with minimal pay raises for teachers and principals, modest funding for child care, and an expansion of state financing of private school students.
In mid-May, the U.S. Census Bureau released its annual survey of school system finances, a credible nonpartisan report of state-by-state revenues from state, local, and federal funding, as well as spending on instruction, construction, and equipment. The 2023 report is based on 2021 data.
North Carolina’s per-pupil revenues of $11,592 placed the state 49th in the ranking of states and the District of Columbia in 2021, according to the Census Bureau. Its per-pupil spending of $10,655 also ranked the state 43rd in the nation.
That represents a modest increase from $9,958 in per-pupil spending in 2020, when the state also ranked 43rd. North Carolina’s 6.3% year-to-year increase, the highest in five years, still fell below the national 7% rise in per-pupil spending.
Adding another layer of analysis, the Census Bureau ranks the states in per-pupil spending relative to overall personal income. This calculation provides a general measurement of a state’s effort to fund schools given its economic capability. In both 2020 and 2021, North Carolina placed 47th among the states.
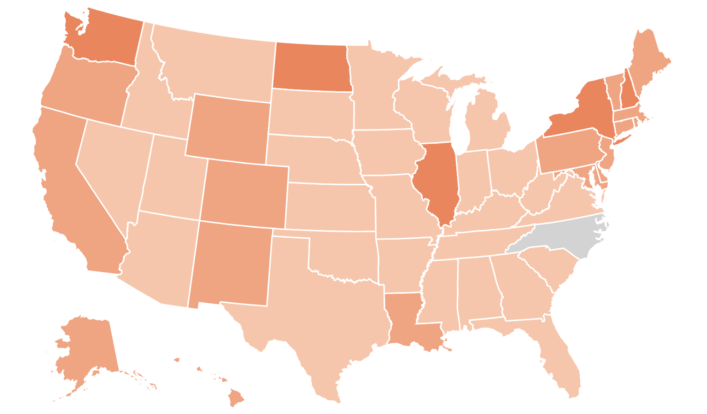
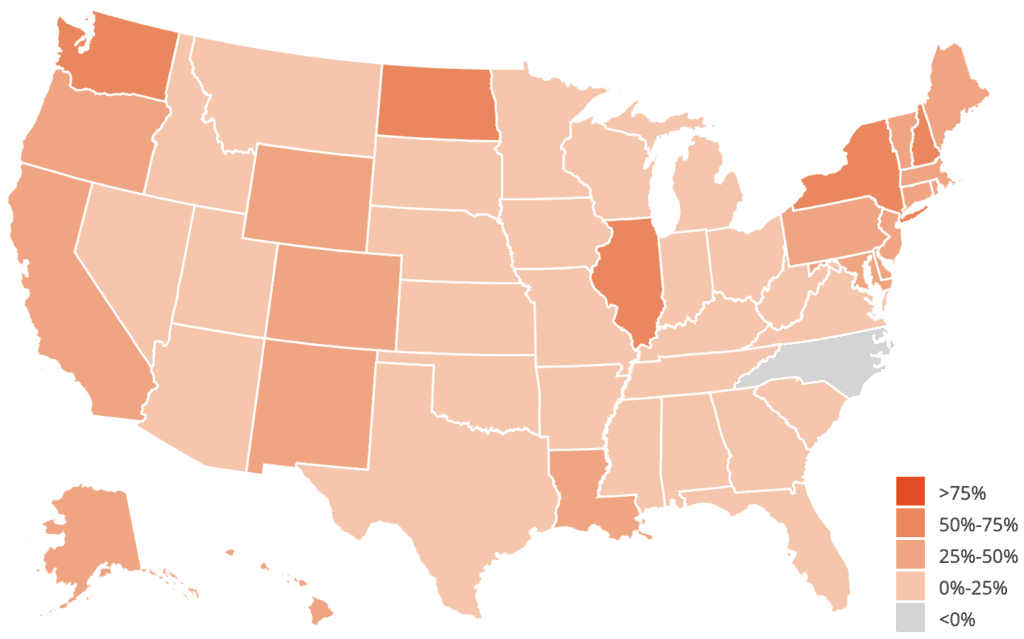
Using the Census data, the Reason Foundation, a libertarian think-tank, has an analysis of revenue trends over the past two decades. On its map showing the states’ K-12 total revenue growth from 2002 to 2020, North Carolina stands as an outlier.
“Nationwide, inflation-adjusted per-pupil K-12 revenues grew by 25%—or by $3,211 per student—between 2002 and 2020,” says the Reason report. “… In per-pupil terms, every state except North Carolina saw an increase in education revenue from 2002 to 2020.”
Over that two-decade period, the Reason Foundation reports, student enrollment declined in 22 states. North Carolina was among the enrollment-growth states — its student count rising by 11% from 1.29 million to 1.44 million.
Public school enrollment growth coincided with the state’s robust population surge and economic transformation. And yet, North Carolina has failed to rise above the bottom 10 states in spending per pupil in pre-K through 12th grade in public schools.
Over time, research has shown that money matters — both how much and how well targeted — in improving public education for young people, for their families, and for communities. A state’s budget expresses values, priorities, and effort. Lingering weak effort gives rise to educational malnourishment.

Recommended reading