Editor’s Note: Many of you know Alex Quigley. He runs Durham Charter School (formerly Healthy Start Academy) and chaired the Charter School Advisory Board for many years.
He currently serves on the Charter School Review Board. When he emailed us with this perspective, he noted that this is “likely an unpopular opinion, but one I think at least deserves to be out there.”
In the interest of transparency, EdNC administered the survey he references in this perspective.
North Carolina has recently embarked on a process to restructure the school report cards that attach a School Performance Grade (SPG) of A, B, C, D, or F to every school in the state. The grades correspond to the standard scale of 90-100 – A, 80-90 – B, etc. Currently, there are two components that determine this grade: proficiency and growth. Eighty percent of the grade is based on the percentage of students at the school that are grade-level proficient based on the state end-of-grade tests. Twenty percent is determined by the amount of academic growth the students make on average in the year.
The movement to alter the SPG really gained traction after the data came out following the 2021-2022 school year. That’s the year we returned to in-person schooling and finally had data that counted again. As expected, the number of schools rated as Fs, Ds, and Cs skyrocketed. Most educators felt deeply demoralized after overcoming incredible obstacles in response to the pandemic only to end up seeing a D or F on report cards, even though we all know that most kids went backward academically. The methodology of calculating SPGs soon came back into question.
In addition to the general feeling that SPGs provide a limited assessment of a school, many also point out misalignment to the National Assessment of Educational Progress (NAEP) when compared to other states. North Carolina has comparable NAEP results to Louisiana, Arizona, and Mississippi — but a higher number of schools marked as Ds or Fs as measured by our EOG/EOC accountability system.
The argument follows that we are being too hard on ourselves. NAEP data tells us that only 32% of the students nationwide are proficient in reading and math. It’s worth considering that perhaps we aren’t being hard enough on ourselves.
Finally, many have pointed out that the grades simply reflect the percent of students in poverty at a given school. This correlation does exist in most cases, but it doesn’t mean the measure is bad. It just means that we have lots more work to do in educating low-income students, and it shows up in the data.
Policymakers, educators, parents, and politicians have now embarked on an effort to stop asking, “What schools move students academically based on data?” and instead focus on, “What indicators yield a clear and accurate representation of a high-quality school in North Carolina?” A lot of components do contribute to overall school success, and it is exceedingly difficult to accurately assess all those factors. That complexity is exactly why we should continue to narrowly focus on the two outcomes that we all know really matter to student success in college and career: academic proficiency and growth.
After a year of surveys, feedback sessions, and focus groups, the momentum appears to be moving toward an overhaul of the SPG system. Recommended potential changes to the General Assembly include adjusting the weighting of proficiency and growth, as well as including other seemingly fuzzy measures such as percentage of students in an elementary school who participate in a “career exploration activity,” “school climate surveys,” or the percentage of students who participate in at least one extracurricular activity. Other, more tangible components like chronic absenteeism will likely be included.
These factors show up in the current data. Kids who don’t come to school do poorly on standardized tests. Schools with unhealthy climates underperform. Moreover, the state actually reports these pieces along with the SPG on the school report card using a number of tables charting things like suspensions and attendance rates. It’s just that the SPG number and letter sit at the top of the page above these indicators.
In my experience, they provide an accurate reflection of what’s happening in the building. I’ve led schools in North Carolina for nearly 14 years, and the data we have from EOGs has always affirmed what I see in my building and others. Kids who pass the tests, particularly those with 4s and 5s, are positioned for success in college or career, and the others are not. I’ve also been in many schools with toxic staff climates as reflected in the twice-yearly Teacher Working Conditions Survey. Those schools don’t generally have high SPG grades. Everything comes out in the student data.
Muddying the SPGs with other indicators will rewrite the story in a way that makes adults feel better but does a disservice to the most disadvantaged students and their families. They will be blinded into believing that their children are better prepared for their futures than they are. We need to face the brutal reality that the pandemic did extensive damage to our schools and students, particularly those students living in poverty. We also need to maintain an unwavering belief that ALL kids, regardless of race, income, or zip code can still achieve far higher academic standards.
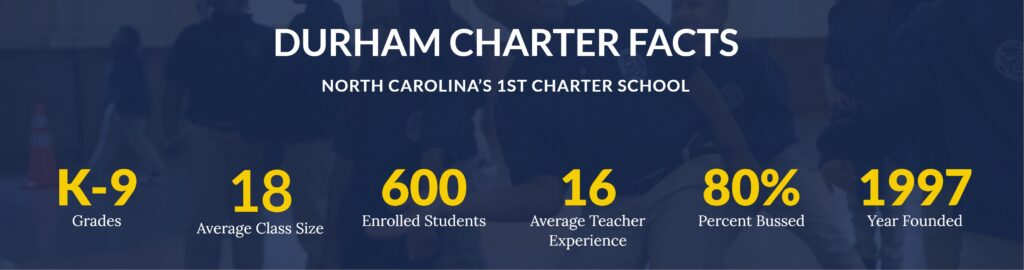
We should believe it can happen because it’s being done. Six years ago, Durham Charter School (formerly Healthy Start Academy) had received an F on its report card every year since the SPG system was introduced. The school was on the verge of forced closure by the NC Charter School Advisory Board.
I came to the school in October 2017, charged by the board to lead a school turnaround effort and orient everything toward academic outcomes. In the first year of the turnaround effort, the school performed in the top 15% of all schools in the state in terms of student growth and moved from an F to D. The following year, we posted growth scores in the top 10% of the state the following year and moved to a C.
Once allowed to return in-person following the virtual year due to COVID, we erased learning loss, realizing an overall 29-point grade-level proficiency gain. Our scholars, 98% who are Black or Hispanic, have narrowed the racial achievement gap to 4 points. Last year, 92% of our third graders were proficient in math on the EOG. Our English Language Learners exceed proficiency rates in the state by 30 points, and DCS was the tenth highest-growth public school of 2,500 in the entire state in 2021-2022. We’ve recently been recognized as a Quarterfinalist for the Yass Prize in Education and a 2022 National Title I School of Distinction.
We aren’t the only school growing students academically regardless of their background. A number of traditional public and charter schools around the state beat the odds every year. For example, over 70% of the students at Gardners Elementary in Wilson County qualify as low-income. In 2023-24, the school earned a high B with a 76 school achievement score and 91 growth score, likely putting them in the top 5% of the state in terms of academic growth. I’m not personally familiar with this school, but something special is happening there that all of us could learn from.
Despite all DCS’s success, the school is still considered a high “C” in our school per SPG, and I believe that’s the grade we deserve. We are rated B in Math but a C in reading, which accurately reflects our current instructional challenges. Our scholars and families are truly exceptional and have accomplished great things, but we still have a long way to go to ensure every scholar is prepared for college or career.
To increase the percentage of scholars who score 3s, 4s, and 5s, we focus a lot on things like early literacy, school climate, and chronic absenteeism. We’re also building a comprehensive extracurricular, career development, and college preparation program. This model provides diverse arts and athletics opportunities typically only available to wealthy kids. It also includes a dual pathway for juniors and seniors to college or career through a partnership with Durham Technical Community College. We believe all these efforts are inputs into the ultimate objective of a “B” and eventually an “A” on our school report card. But we don’t want that grade to be based on all the stuff we are doing. We want that grade to be about all our kids achieve.
As the great leader John Wooden said, “Never mistake activity with achievement.”
In about a month, schools across the state will send home first-quarter report cards. Every student will earn an A, B, C, D, or F in every class. Their grades won’t change based on what “career exploration activity” they took or how many extracurriculars in which they participated, because doing so would give an inaccurate picture of their actual performance on academic standards.
We continue to assess, score, and rank students entirely on their performance on academic criteria, not the other indicators such as their study habits or if they sign up for internships. It seems only reasonable that schools should be held to the same standards that we hold our students.

Recommended reading