
BEST NC is pleased to announce the update of its Per Pupil Expenditure (PPE) Data Explorer and landing page, designed to facilitate the understanding and exploration of North Carolina’s school-level spending data and its relationship to other key education indicators.
The updated tool features school-level and district-level expenditure data from the 2018-19, 2019-20, and 2020-21 school years. Charter school expenditure data has also been added. Additionally, the tool now offers the ability to examine longitudinal changes in spending at the school level and the ability to view COVID relief fund expenditures at the district level.
About the tool
The federal Every Student Succeeds Act of 2015 requires each state education agency to release school-level per-pupil expenditure data. The 2018-19 expenditure data were released in 2020, marking the first time spending data were made available at the school level in North Carolina and uncovering trends that have been masked by district-level data.
BEST NC’s web-based Per Pupil Expenditure Data Explorer allows education stakeholders to explore per-pupil funding trends across individual schools, within districts, and across districts in North Carolina. Educators, school leaders, parents, policymakers, advocates, and other members of the public can utilize this tool to examine education spending and student outcomes for similar schools based on size, grade level, geography, percentage of students with disabilities, poverty, and more.
By comparing schools with similar characteristics, school leaders and other education stakeholders can identify schools with strong student performance at varying levels of funding and/or relative to the characteristics of their student body. Promising or innovative practices from these schools might then be examined to help improve teaching and learning in similar schools.
Note: Student performance metrics are unavailable for the 2019-20 school year, as all end-of-year tests were canceled due to the COVID-19 pandemic. Additionally, in 2020-21, students took end-of-year tests, but North Carolina was granted a waiver from federal accountability requirements, meaning that student proficiency numbers are available, but other school-level metrics – such as School Performance Scores, School Achievement Scores, and School Growth Scores – are not. These data will be available for the 2021-22 school year.
The Per Pupil Expenditure Interactive Data Explorer can be accessed on BEST NC’s PPE landing page, alongside summary analyses (see below) and additional resources.
Insights and trends from the data explorer: Key findings about North Carolina’s public schools
With the release of school-level expenditure data, and with the help of BEST NC’s Per Pupil Expenditure Data Explorer, North Carolinians can now explore trends in school spending at the school level, instead of being limited to district-level metrics. Several school-level insights are highlighted on the PPE landing page. Examples of these findings include:
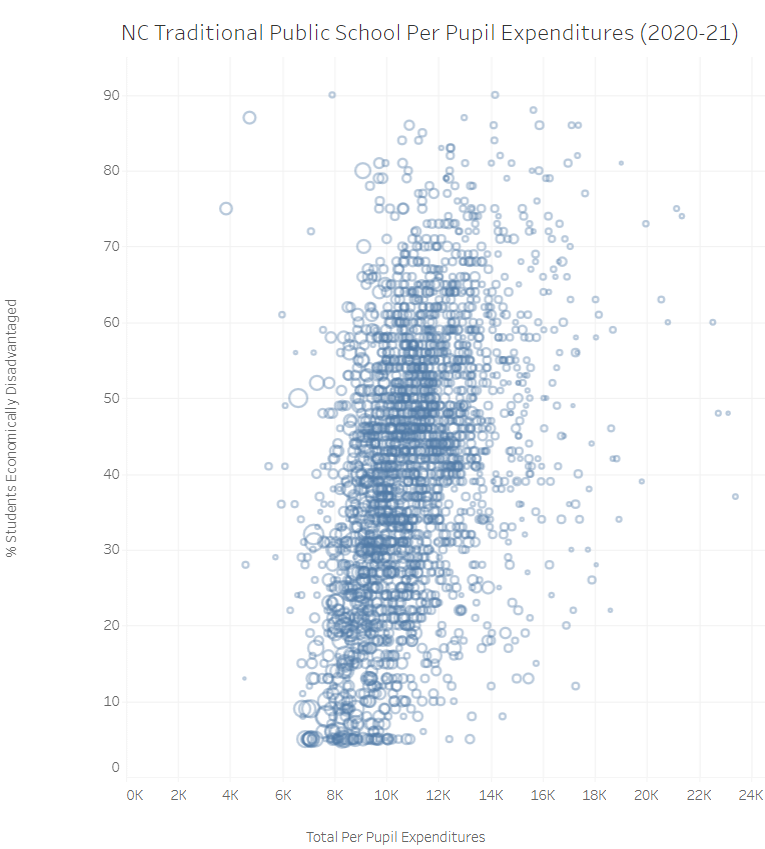
- Generally, total per-pupil expenditures in North Carolina are higher in schools with greater numbers of economically disadvantaged students. In 2020-21, about $3,100 — 32% — more was spent per pupil in the highest poverty schools (schools where 76-100% of students are economically disadvantaged), compared to the lowest-poverty schools (schools where 0-25% of students are economically disadvantaged). In a school with 500 students, this equates to around $1.6 million in additional resources. In this way, North Carolina defies national trends in which lower income schools generally receive less funding than more affluent schools.
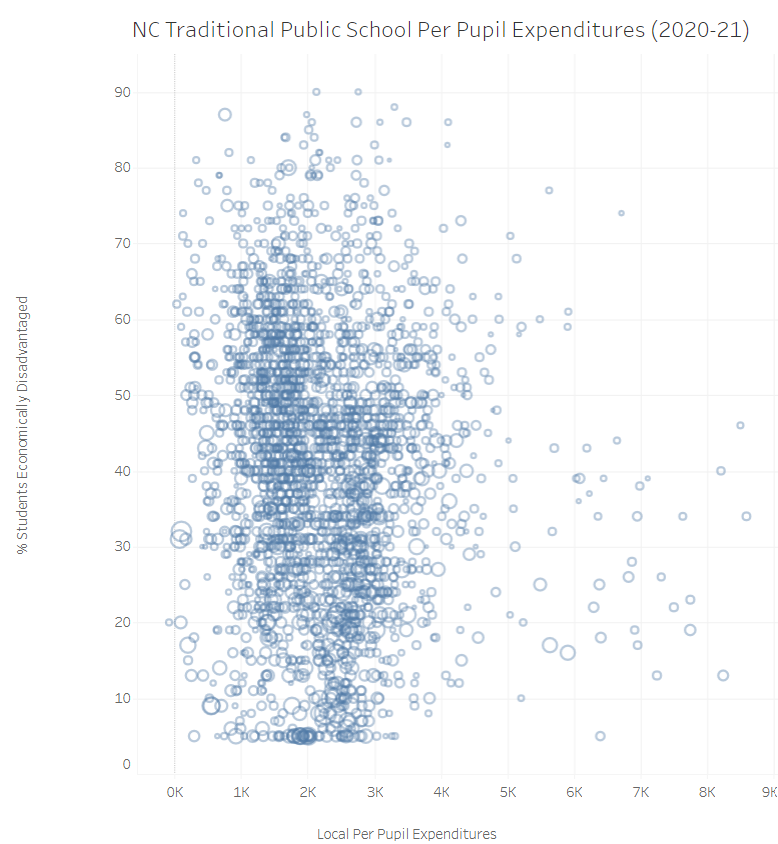
- In general, expenditures of local funds, even within an individual district, appear to be uncorrelated with poverty, so funding equity in most districts is a function of state and federal funding allocations.
- Total per-pupil expenditures (including state, federal, and local funds) increased by $726 per pupil, or 7.5%, over the three-year period from 2018-19 to 2020-21 (see note below). $524 of this increase was due to an influx of federal COVID relief dollars.
Note: The 2018 North Carolina state budget was passed in June 2018. Partially due to the COVID-19 pandemic, there was not another comprehensive state budget bill passed into law until November 2021, though some smaller appropriation bills were passed that funded education items.
- Since March 2020, North Carolina’s K-12 public schools have received over $6 billion in COVID relief funds from the federal government. Schools and districts spent $90 million in COVID relief funds during the 2019-20 school year, $660 million during the 2020-21 school year, and over $2 billion during the 2021-22 school year. Schools have until September 30, 2024 to spend the remaining COVID relief dollars.
While COVID relief fund expenditures are not available at the school level (but are embedded in the state and federal fund amounts), district-level data reveal that more COVID relief were spent by districts with higher percentages of students identified as economically disadvantaged. This is likely because COVID relief funding was allocated according to the federal Title I funding formula which is designed to support schools with high concentrations of students in poverty.
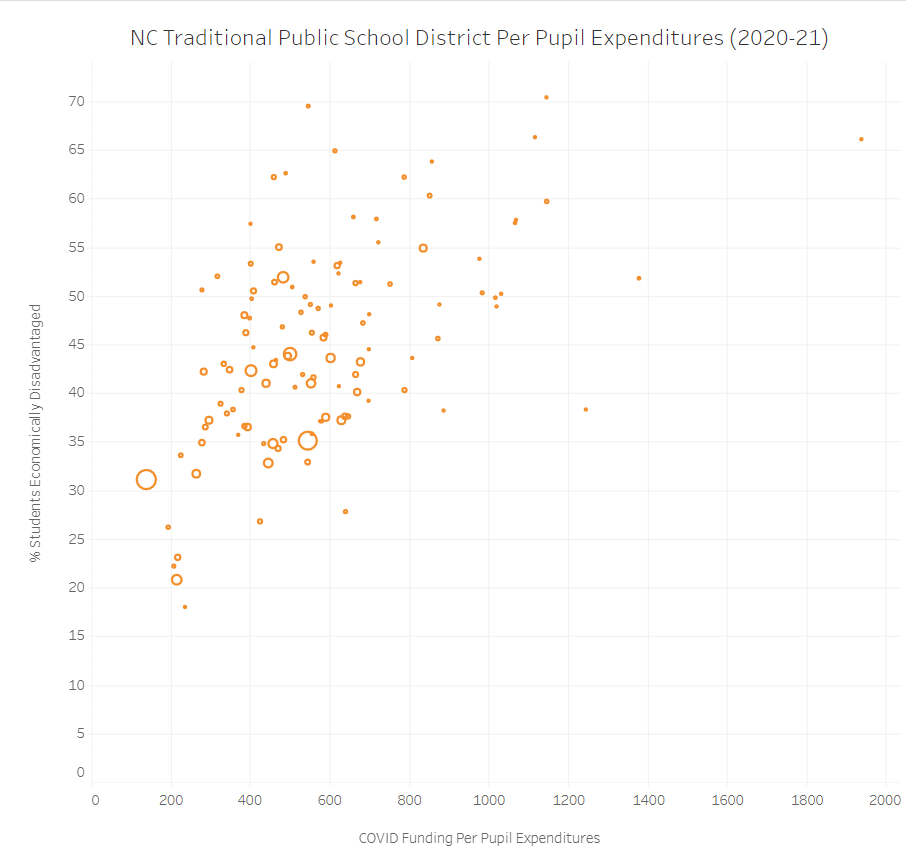
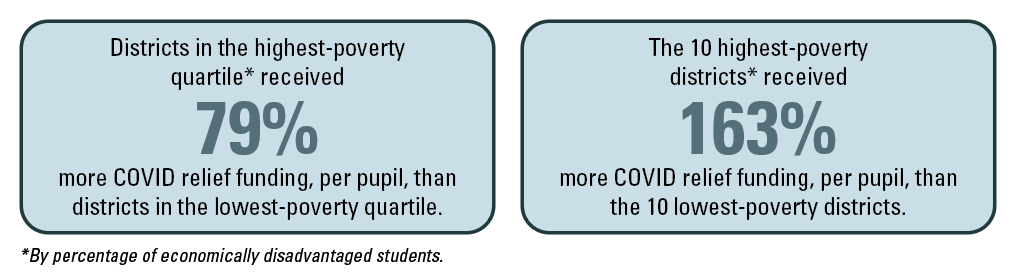
An in-depth analysis from the 2022 Facts & Figures guide found that districts in the highest poverty quartile received 79% more COVID relief funding, per pupil, than districts in the lowest poverty quartile, and the 10 highest-poverty districts received 163% more COVID relief funding, per pupil, than the 10 lowest-poverty districts.
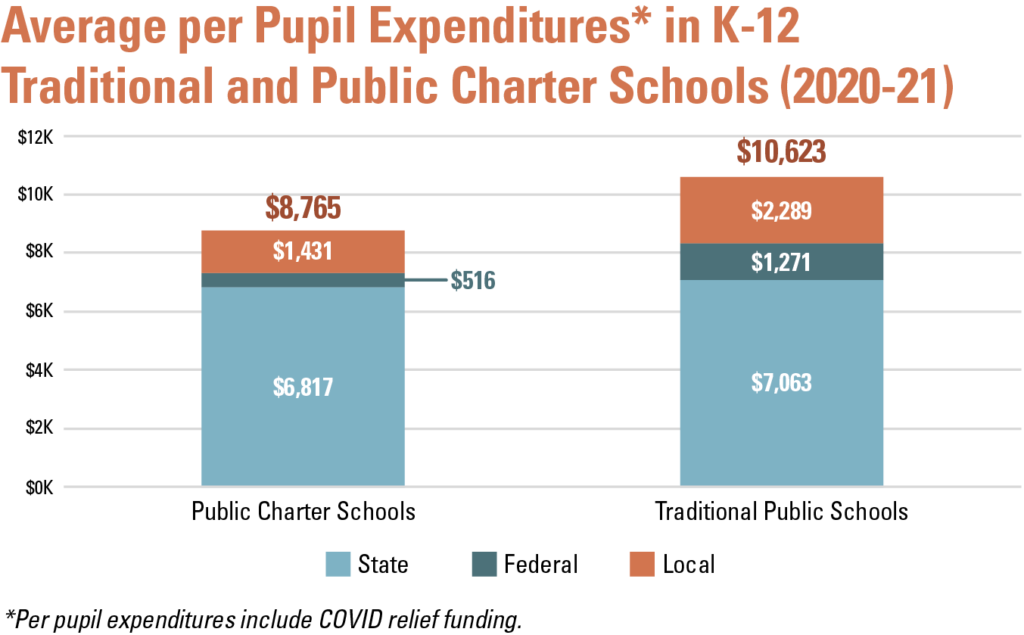
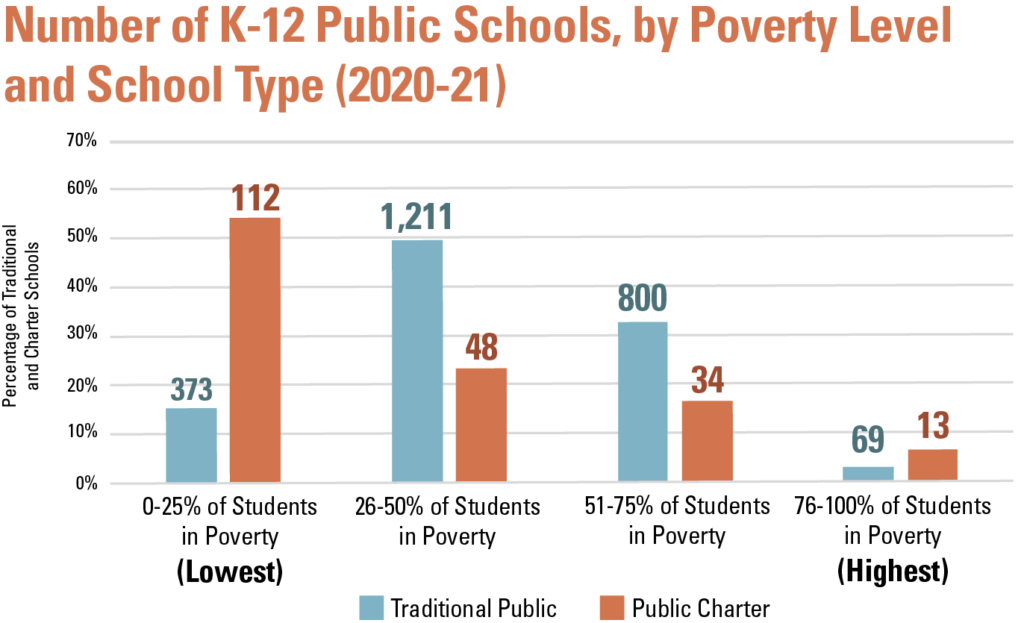
In 2020-21, average per-pupil expenditures were $10,623 in traditional public schools and $8,765 in public charter schools. Charter schools, meanwhile, tended to serve students with lower levels of poverty: 54% of charter schools had less than one quarter of their student population living poverty, compared with 15% of traditional public schools.
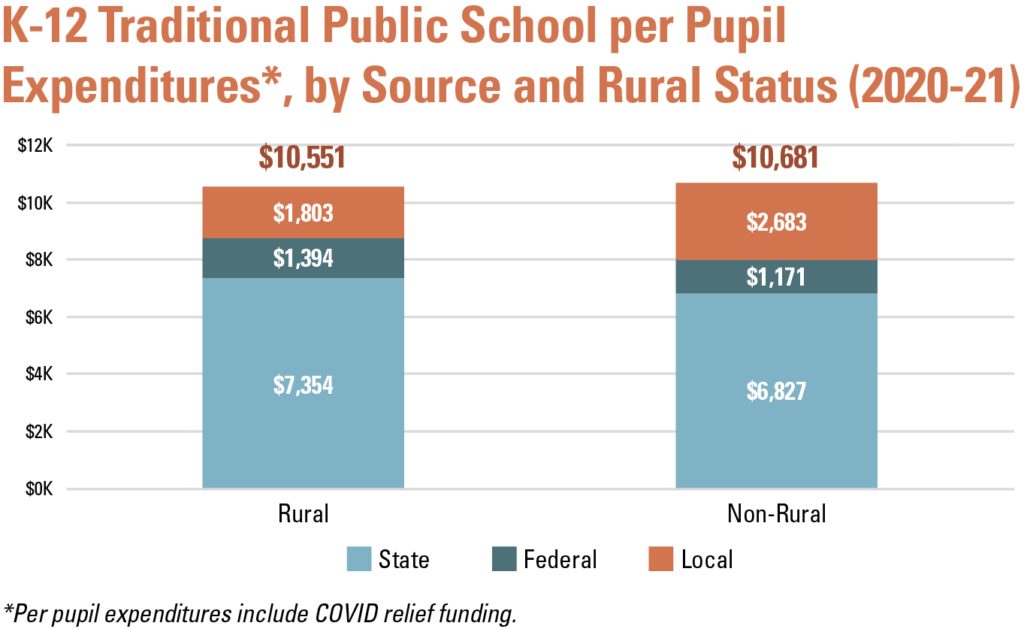
Rural schools in North Carolina (as identified by the U.S. Department of Education) spent about as much, per pupil, as non-rural schools in 2020-21. Local funding for rural schools was lower than non-rural schools by 33%, but state and federal funding for rural schools is higher than in non-rural schools by 7% and 16%, respectively, making up most of the difference in per-pupil funding. North Carolina has the second largest population of rural students in the country, behind only Texas.
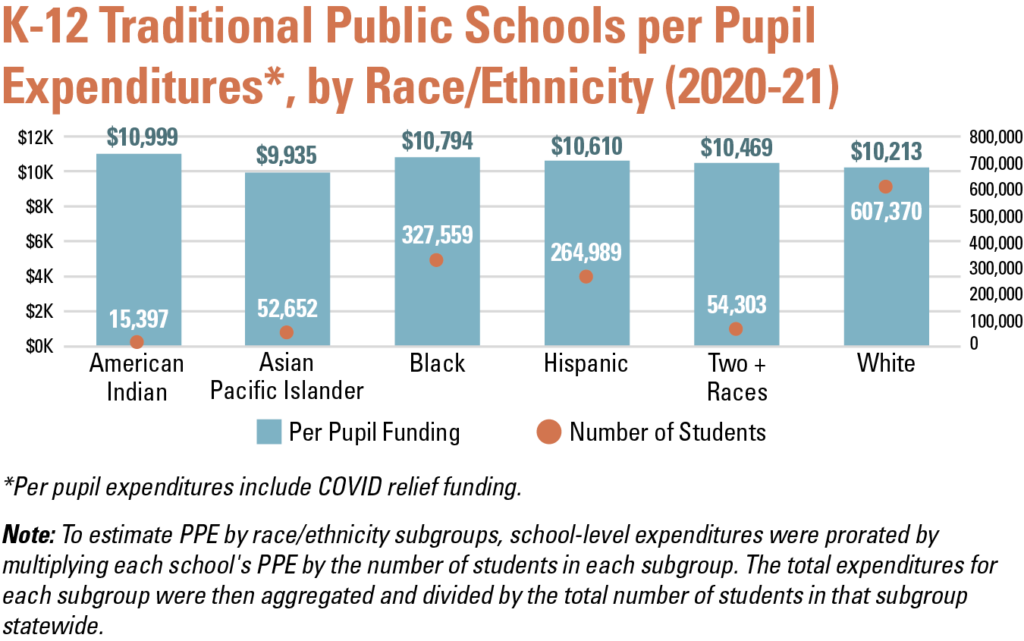
By prorating school-level per-pupil expenditures at the school level according to the proportion of students in each racial/ethnic subgroup, it is possible to calculate per-pupil expenditures by race/ethnicity. In 2020-21, per-pupil expenditures were highest for American Indian and Black students, and lowest for Asian/Pacific Islander and White subgroups.
We encourage state, district, and school leaders to examine these data and look for inspiration and best practices from schools in our state that are succeeding relative to similarly resourced schools and/or student populations. In the years ahead, as schools and districts continue to implement COVID recovery plans and school-level accountability metrics once again become available, this tool will be updated.
Note: As with any large data set, we encourage caution in making causal assumptions. This tool is intended to be a starting point for robust conversations about best practices, wise investments, and — most importantly — how to ensure student success.

Recommended reading