
In a data presentation from Education Week, released as part of its Policing America’s Schools series, North Carolina had the third highest percentage of schools with police in the nation in the 2013-14 school year at about 55 percent.
At the same time, however, North Carolina had the second lowest “percentage of arrests” at 0.016 percent — which reflects the number of arrests in relation to the state’s student enrollment. There were 239 arrests in N.C. schools that year. The data includes Washington, D.C.
About 43 percent of students who were arrested in 2013-14 were black, while black students only represented 26 percent of overall enrollment. Black students being disproportionately arrested is the case in the majority of states, Education Week reporter Evie Blad, who worked on this series, told NPR.
“We found that, in 28 states, the share of arrested students who are black is at least 10 percentage points higher than their enrollment in schools that arrested students,” Blad said in the NPR article. “And in 10 states, the gap is at least 20 percentage points.”
Education Week also provides closer looks into each state’s individual schools. You can look at the police presence, arrests, referrals, and racial breakdown of the statistics at N.C. schools here. Within North Carolina, 23 schools had arrests in 2013-14.
Lee County High in Sanford had 46 arrests that year, compared to the second highest number of arrests in the state at Davie County High in Mocksville with 26 arrests.
At Lee County High, 58.7 percent of the students arrested were black. Only 22.2 percent of the school’s population is black.
In 2015-16, reportable acts of school crime are down 3.2 percent from the 2014-15 school year, according to a report released recently by the state Department of Public Instruction.
The consolidated data report to the General Assembly, which was presented to the State Board of Education last Thursday, does not track arrests. The report focuses on reportable crimes, short-term and long-term suspensions, expulsions, and corporal punishment.
The number of reportable crimes for all grades decreased 3.2 percent, and the crime rate decreased 3.9 percent. When looking at just grades 9-13, the number of reportable crimes dropped by just over one percent and the crime rate decreased 3.3 percent.
In high school, males more frequently committed crimes, as did ninth graders. American-Indian students had the highest crime rate in schools, followed by black students.
Out of the offenses that schools reported — there are 16 categories — only 1.8 percent were dangerous or violent. And 96.3 percent of reported crimes fell into either illegal possession of controlled substances, alcoholic beverages, and weapons (excluding firearms or powerful explosives), or assault on school personnel.
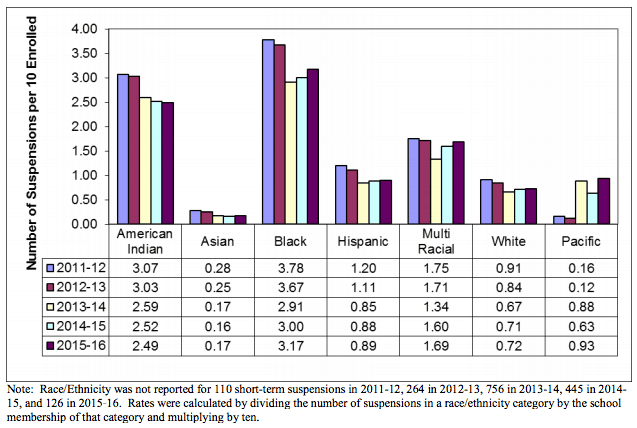
Short-term suspensions, on the other hand, increased for the second year in a row. The state saw an overall 4 percent increase in short-term suspensions from 2014-15 to 2015-16 and a 2.3 percent increase in high school short-term suspensions. Ninth graders were the most likely grade to receive short-term suspensions. Males were more likely to receive short-term suspensions, but both genders rose. All racial groups rose in short-term suspensions except American-Indian students. Black students received 57 percent of short-term suspensions.
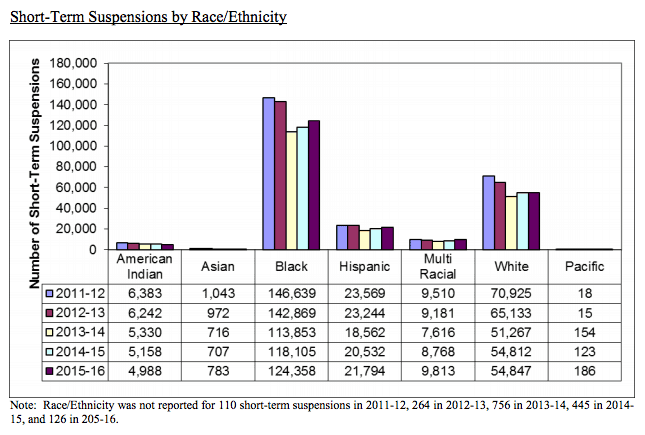
The following graph shows short-term suspensions by race/ethnicity per 10 students enrolled in the state’s schools.
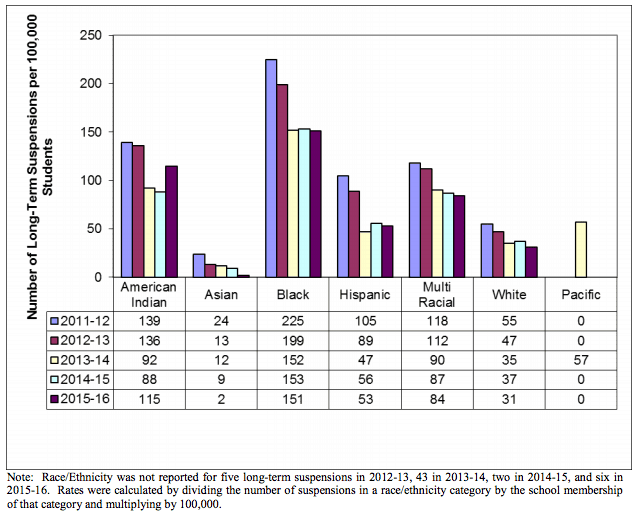
The state’s long-term suspensions experienced a 4.5 percent decrease from the previous year. There was a 7.8 percent decrease in the number of long-term suspensions for high school students. Males were more likely to receive long-term suspensions, but both genders had fewer long-term suspensions than the year before.
American-Indian and multiracial students received more long-term suspensions than the previous year. Hispanic and Pacific Islander students received the same number of long-term suspensions, and all other racial groups decreased. About 58 percent of long-term suspensions were given to black students.

Below is a graph showing long-term suspensions by race/ethnicity per 100,000 students enrolled.
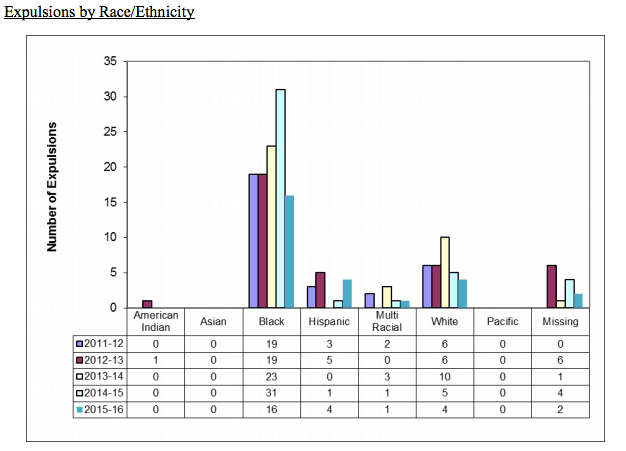
Expulsions decreased by 35.7 percent from 2014-15 to 2015-16 — from 42 to 27 expulsions reported. High school expulsions decreased as well — with 21 expulsions in 2015-16 compared to 37 the previous year.
Males were more likely to be expelled, although their numbers are down from the previous year, while female students’ numbers stayed the same. The number of Hispanic students expelled increased, while all other racial groups either stayed the same or decreased. Black students received about 59 percent (16 expulsions) of the total expulsions — but that number is down from 31 expulsions in 2014-15.
Below is a presentation of the data from last week’s State Board meeting:

Recommended reading