Is it just me, or does the summer always feel like it’s full of possibility and exciting choices? As an adult working full-time, my summer options are more limited than when I was growing up, but students in North Carolina now have more choices to make than ever before: not only do they have volunteer and job options, summer reading, and pool parties to consider, but some students may also be looking at alternatives to their traditional public school options for the fall.
When my parents were in school, choice wasn’t even a consideration. They were assigned a school based on where they lived and stayed in the same school track as all of their neighbors, from elementary through high school. Beginning in the 1980s, however, the idea that families should have some choice in the schools their students attended gained momentum, growing from a handful of larger districts that offered a few magnet schools to a much wider menu of options in most districts, including charter schools and even private schools for students who receive publicly-funded tuition support.
This summer, Consider It Mapped will be looking at school choice data as parents and students tackle their decisions for the upcoming year. What does choice look like in North Carolina today? What publicly-funded choices do students and their families have? Do all students in North Carolina have the same number of choices? This month, we’re going to look at one of the most established public school choice options in North Carolina: charter schools.
In North Carolina, charter schools are part of the public school system. Charter school legislation passed twenty years ago in June 1996, the first charter schools in North Carolina opened in 1997, and by the 2015-16 school year, there were nearly 160 in operation all across the state. Charter schools are held to the same growth and performance standards as traditional public schools and receive federal funding. They differ from other public schools in that they operate independently of many of the regulations imposed on traditional public schools, meaning that they can choose their own curriculum, daily schedule, overall school structure, and more, with combinations varying from school to school. Public charters are tuition-free and are not religiously-affiliated, but they do require students to apply to attend. Any student can apply to attend a charter school, but if there are more applicants than seats, schools choose entrants through a lottery.
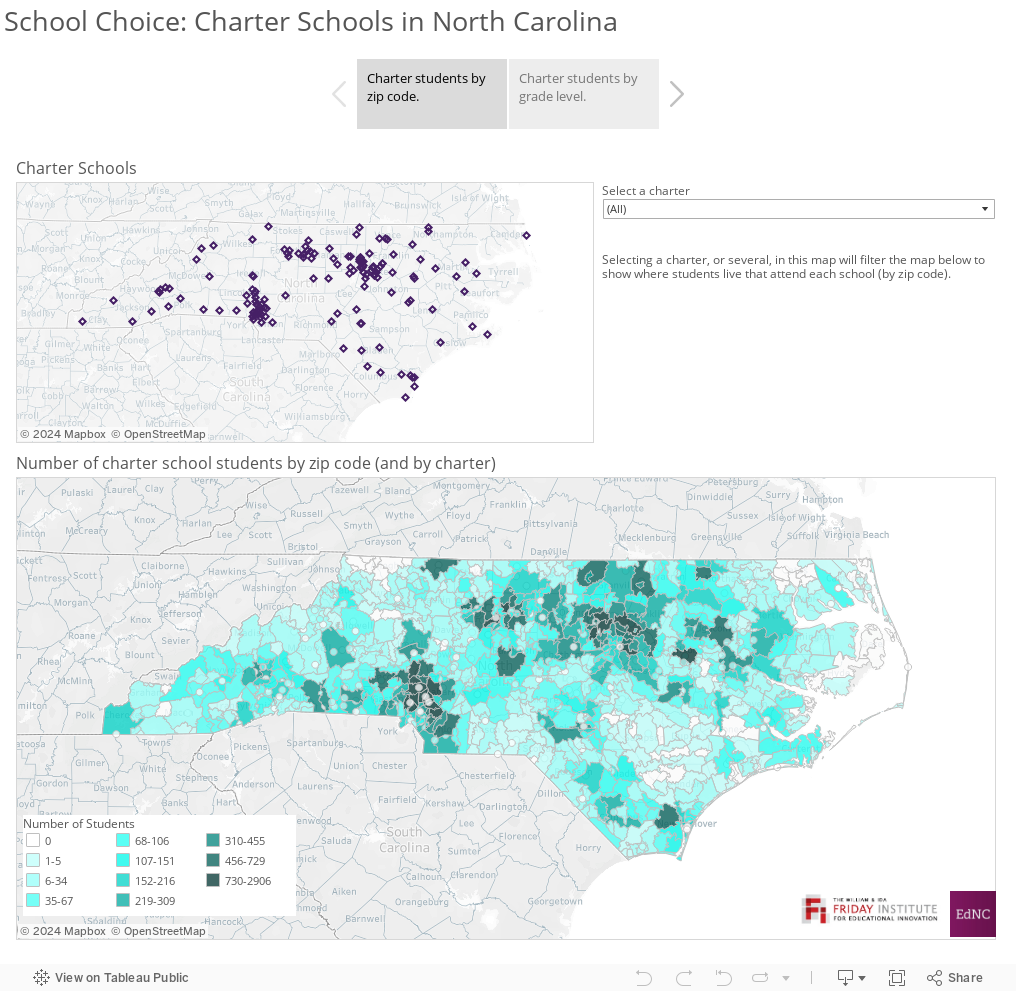
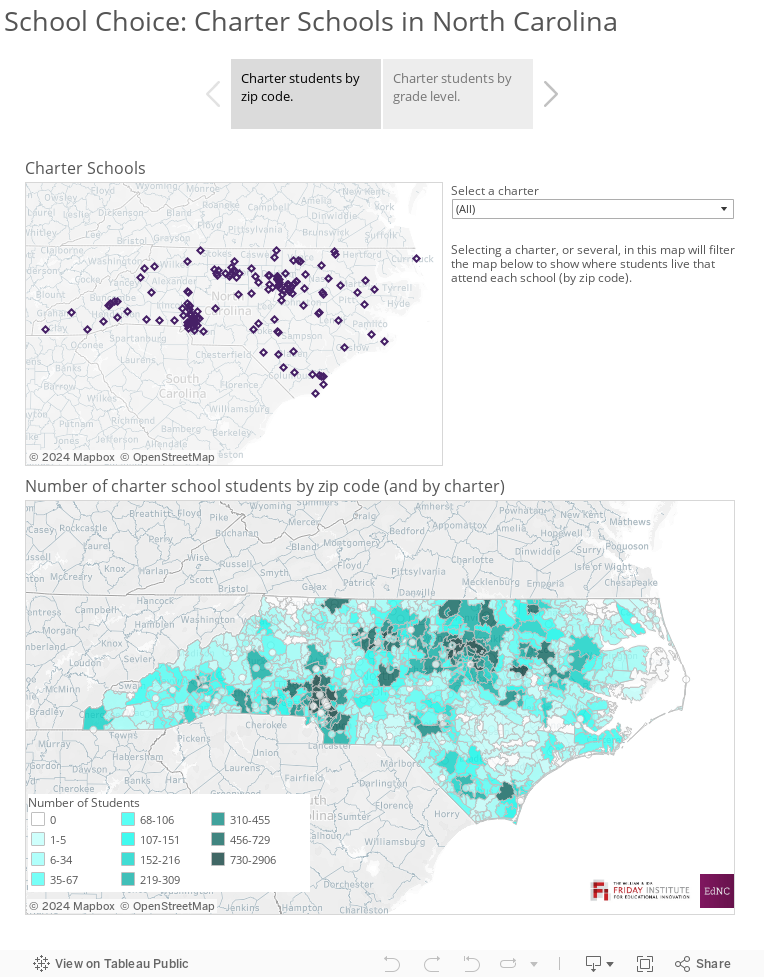
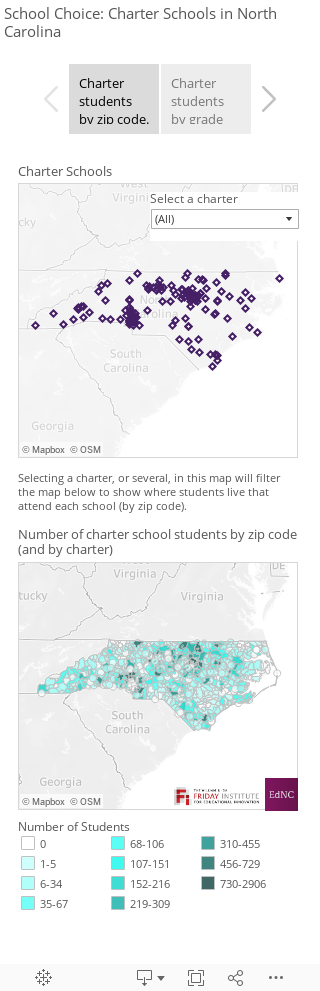
Because there are no location restrictions for charter school students, students can come from anywhere in the state to attend any of the public charters. Using student home zip code data,1 we were able to look at the distribution of charter school students across the state and by school. Not only does this help us to determine if students are relatively local to their schools or are traveling long distances to attend, but it also helps us to identify areas of the state in which student access to charter schools appears to be more limited.
The overall map of student distribution by zip code shows much of what you might expect — there are higher concentrations of charter school students (shown as darker colors on the map on the first page) in areas around cities. Not only are there more students in these areas to begin with (because metro areas have higher populations) but also there are typically more charter schools.
The real interest in this map is in the geographic spread of students who attend each charter school, which we can explore by filtering the map for specific charters.
While we can’t make judgments on exactly how far students travel to school based on zip code alone, we do find that some schools are more localized in terms of their student populations, and some host students from adjacent counties or beyond. Filter for The Learning Center charter school for an example of a school with a localized student population, and filter for Anderson Creek Club Charter for an example of a charter school with a wider geographic influence.
There are many possible explanations for differences in charter schools’ geographic influence, a few of which could include: parents or guardians who live in one county but commute to another for work and drop their children off on the way (charter schools typically do not provide transportation); children with two residences (for instance, if their parents are separated and the official home address is not the same as the weekday address); or data errors (we filtered out some of the zip codes in our data because they were incomplete, and we filtered other zip codes because they were located in Washington State!). In many cases, the differences may be related to the charter schools themselves. For example, some charter schools may invest more effort in recruitment, and some may have programs or approaches that are attractive enough to convince students from farther away to attend. All of these factors and more can impact a family’s choice and suggest interesting topics for further study as we learn more about how choice works in public school.
The second element pertaining to school choice and charter schools we wanted to explore this month is the distribution of charter students by grade level; i.e., do charter schools typically offer only certain grade levels and therefore offer more choice to certain ages of students, or is the distribution of students by age in charters proportional to the distribution in traditional public schools?
Currently, public charter schools appear to cater mostly to elementary-aged students (students in kindergarten through 5th grade). This is most easily seen in the bar chart that accompanies the map on the second tab when “All” is selected: the teal section of the charter bar (the elementary-level population) is much larger than the other sections of the bar.
But are the numbers of charter school students proportional to those in traditional public schools?
The answer here is no — while about 47 percent of traditional public school students are in elementary grades, that number is 55 percent for charters. The proportion of middle school students (grades 6-8) is relatively close for traditional public and charter schools at 23 percent and 27 percent, respectively, but the real gap is in high school (grades 9-132) education — about 30 percent of traditional public schools are comprised of high school students, but only about 18 percent of high school students attend charter schools.
The bar chart tells us nothing about the proportion of charter school students versus traditional public school students in different areas of the state, however, so we have mapped that as well at the county level. Overall, it appears that the counties with the highest proportion of charter school students are Northampton (where 34 percent of the public school students attend charter schools) and Pamlico (27 percent). As you change the view by selecting grade ranges, the proportion of charter students shifts in many counties, which aligns with our earlier discovery that there are more charter school spaces for students in elementary grades than in other grades. Click on specific counties to see the distribution of charter to traditional public school students in the bar charts above.
One of the main debates in the conversation about public school choice — and one that this month’s maps start to consider — is how much choice a public system can and should accommodate. A totally open-choice system would give parents the ability to choose what they think is the best educational option for their children, but can all families be guaranteed equitable levels of choice, and, if we move toward this level of choice, what control measures would we need to maintain in order to ensure quality across choices? What is the right balance to strike? If you have ideas as we continue to explore the landscape of choice in North Carolina in the coming months, reach out to us in the comments below.
About the author