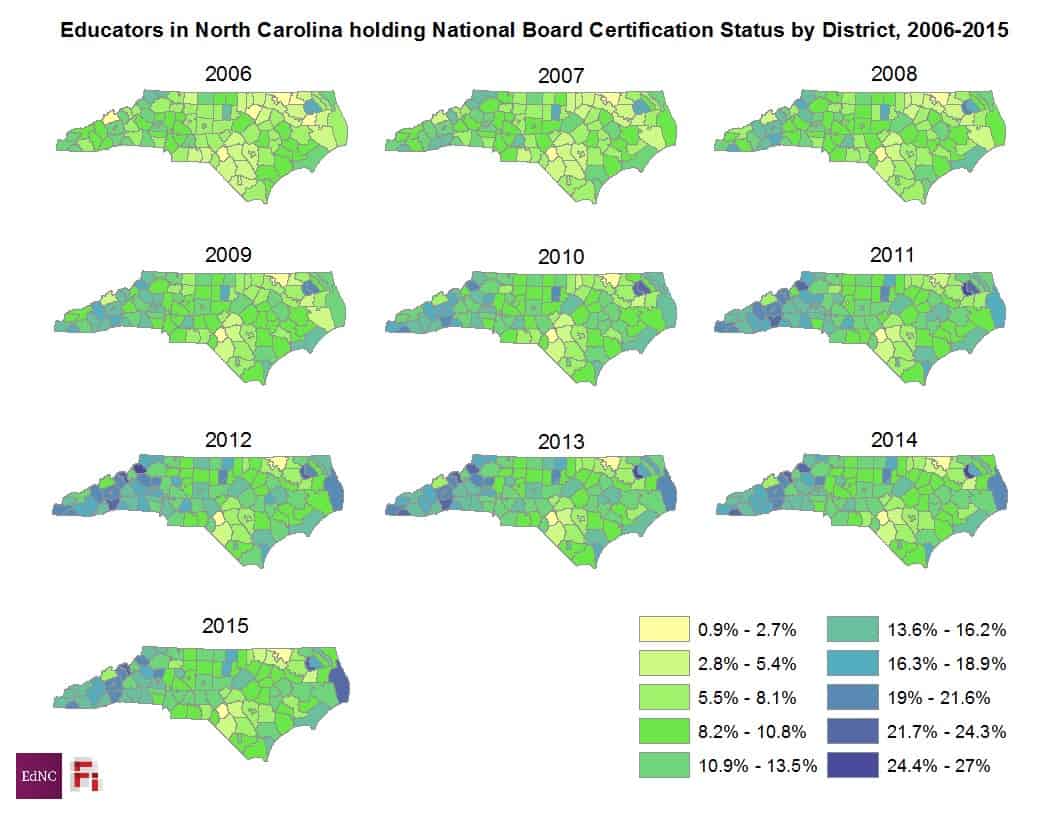
This month on Consider It Mapped, we continue to look at data on National Board-certified teacher distribution across North Carolina. As in last month’s feature, this month’s map shows the distribution of teachers with Board certification across the state in 2015, but also the change in distribution across the state over time. There are a number of reasons teachers choose to become Board-certified, including personal desire to further their teaching skills and professional desire to increase their earning potential, but has the percentage of Board-certified teachers increased drastically overall since 2006 or remained relatively stable?
Data about teacher certification from the Department of Public Instruction (DPI) allow us to examine the distribution of Board-certified teachers in North Carolina as far back as the 2006 school year. In the past, DPI has provided metrics for teacher certification as far back as 2001, but recently culled the publicly available data sets to 2012-2015. The data sets differentiate between Board-certified teachers in eligible classroom roles and personnel who hold Board certification but who are not necessarily in a role eligible for additional compensation (i.e., they are certified but not in a position that is eligible for the 12 percent bonus because they are not directly applying their training). This series maps data on all personnel who hold Board certification since that data source was consistently available across the ten-year time span.
https://www.youtube.com/watch?v=0B3szoTyFuQ&feature=youtu.be
Overall, the proportion of Board-certified teachers by district appears to have increased the most in the mountain and coastal plain regions. However, in many of these districts, while the proportion of Board-certified teachers increased through 2012, after that point many of these same districts began to experience a decrease in their proportions of teachers who were Board-certified. In the Piedmont, a handful of districts (e.g., Orange, Chapel Hill-Carrboro, and Wake) have seen increases in Board-certified teachers, but the proportion of Board-certified teachers in most other districts have remained relatively static over the past 10 years.
Perhaps most interesting of all is the general decline statewide in the proportion of Board-certified teachers by 2015. One possibility for this dip is that number of teachers vying for Board certification could be linked to average teacher salary over the years, with more teachers opting for certification when salaries decline or remain stable (as was the case between 2008 and 2014) to help offset those declines; institutions of higher education experience a similar phenomenon in terms of enrollment, with enrollments increasing when unemployment rates rise.
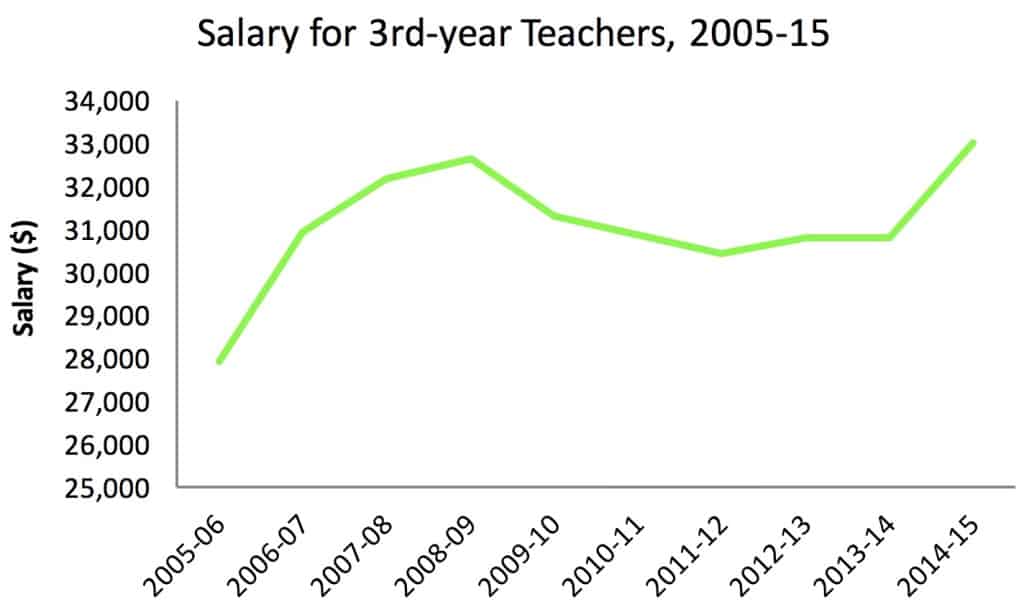
Taking a cursory look at the average teacher salaries between 2006 and 2015, as pulled from teacher salary schedules for third year teachers1 by year, average teacher compensation increased between the 2005-06 and 2008-09 school years and then decreased or otherwise remained relatively stable in the school years that followed until 2014-15 when teacher salaries increased again. Growth in the proportion of teachers opting for Board certification did increase steadily in many districts between 2005 and 2009, but growth was much more widespread and steady in many areas between 2010 and 2012 — paralleling years in which teacher salaries remained frozen. In the maps from 2013 to 2015, it appears that proportion of National Board-certified teachers stayed high but did not continue to grow or decreased, steadying along with the salaries during that time period.
According to this theory, the increase in teacher salary in 2015 could potentially show a degree in teachers opting for Board certification in the year that follows. Though the relationship is correlational only and not necessarily causal (as discussed in this earlier Consider It Mapped post), it does suggest that there may possibly be a connection between changes in teacher pay and the proportion of teachers who seek Board certification.
Over the past several months, we have been using maps like these to begin to look at questions like the ones posed above and to explore some of the related questions they lead us to consider. For example, this month’s and last month’s maps raise additional questions about the distribution of Board-certified teachers, such as whether the distribution of Board-certified teachers is impacted by teacher pay over the years, or whether distribution is linked to location:
What is the economic climate like in areas where teachers opt for Board-certification?
Are there other jobs available to would-be teachers or are there fewer options?
Do Board-certified teachers tend to cluster in popular locations like Asheville and Chapel Hill because of features of these towns external to teacher pay and conditions?
Our maps only help us to begin to explore some possible answers to these questions. However, they are only the beginning of the process of gaining a deeper understanding that comes from additional research and input from people with relevant experience and knowledge about these topics.
Do you have thoughts you’d like to share? If so, reach out to us on EdNC.org.
About the author