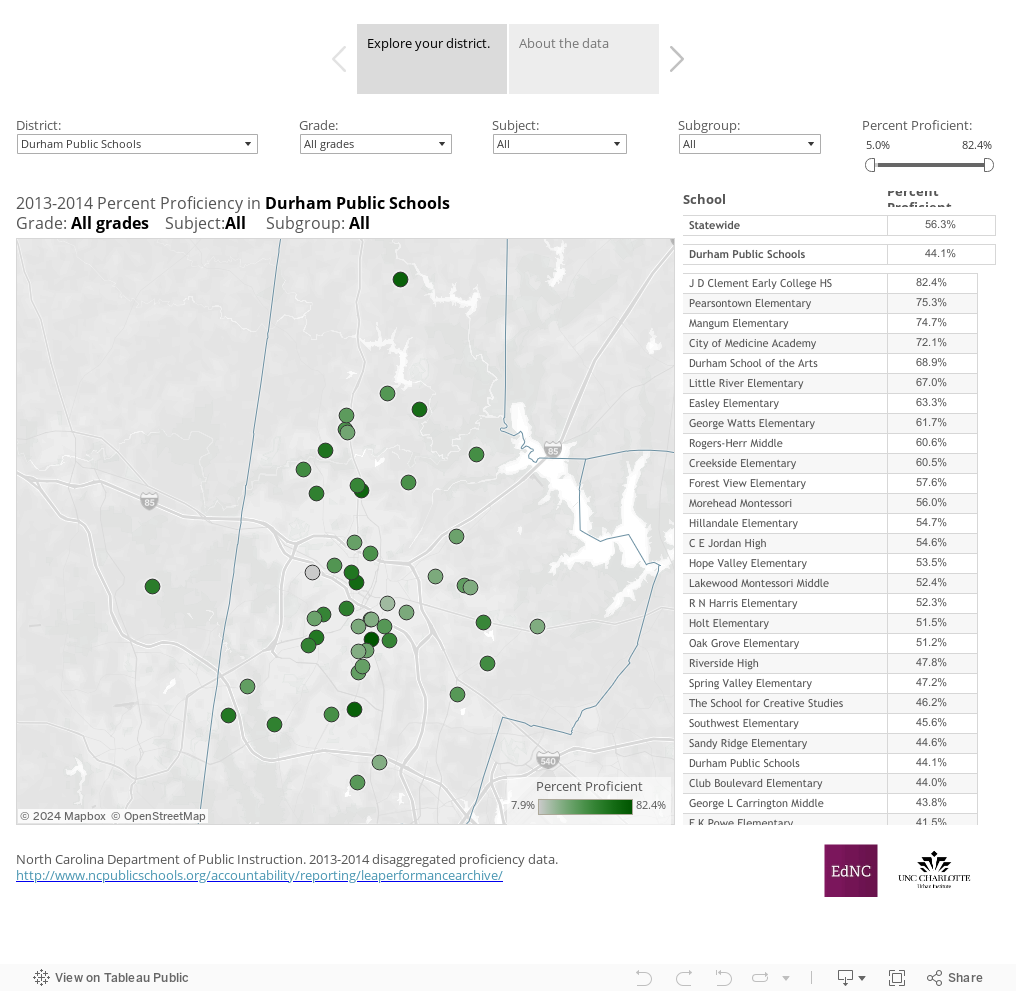
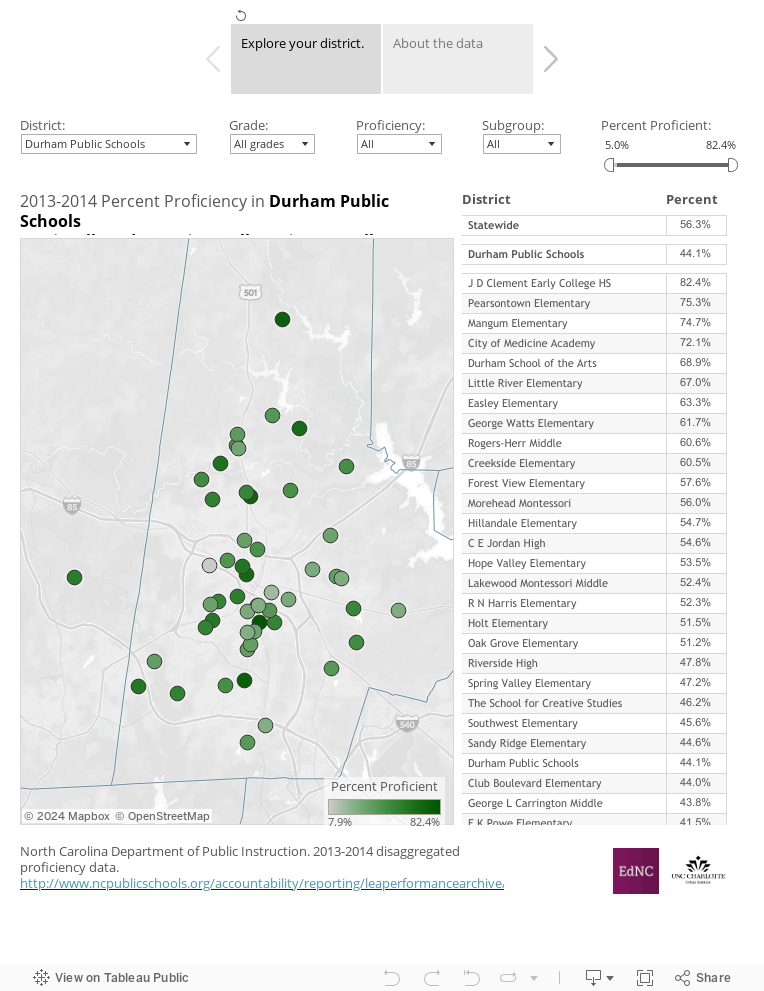
This week’s map takes a closer look at the newest proficiency data at the school level. The table to the right of the map lists proficiency rates in descending order for the subject and grade selected for all schools in the district. You can also view school proficiency rates for specific grades, subjects, and student subgroup by using the dropdown menus above the map. If the map does not appear, no data are available for that combination.
Although noted in the previous posts, it is worth restating that the definition of “proficient” has changed. Up through 2012-13, test scores were grouped into 4 achievement levels, with the top two (levels 3 and 4) considered proficient. In 2013-14, the number of achievement levels increased to 5, and the top 3 (3, 4, and 5) are proficient.
About the author