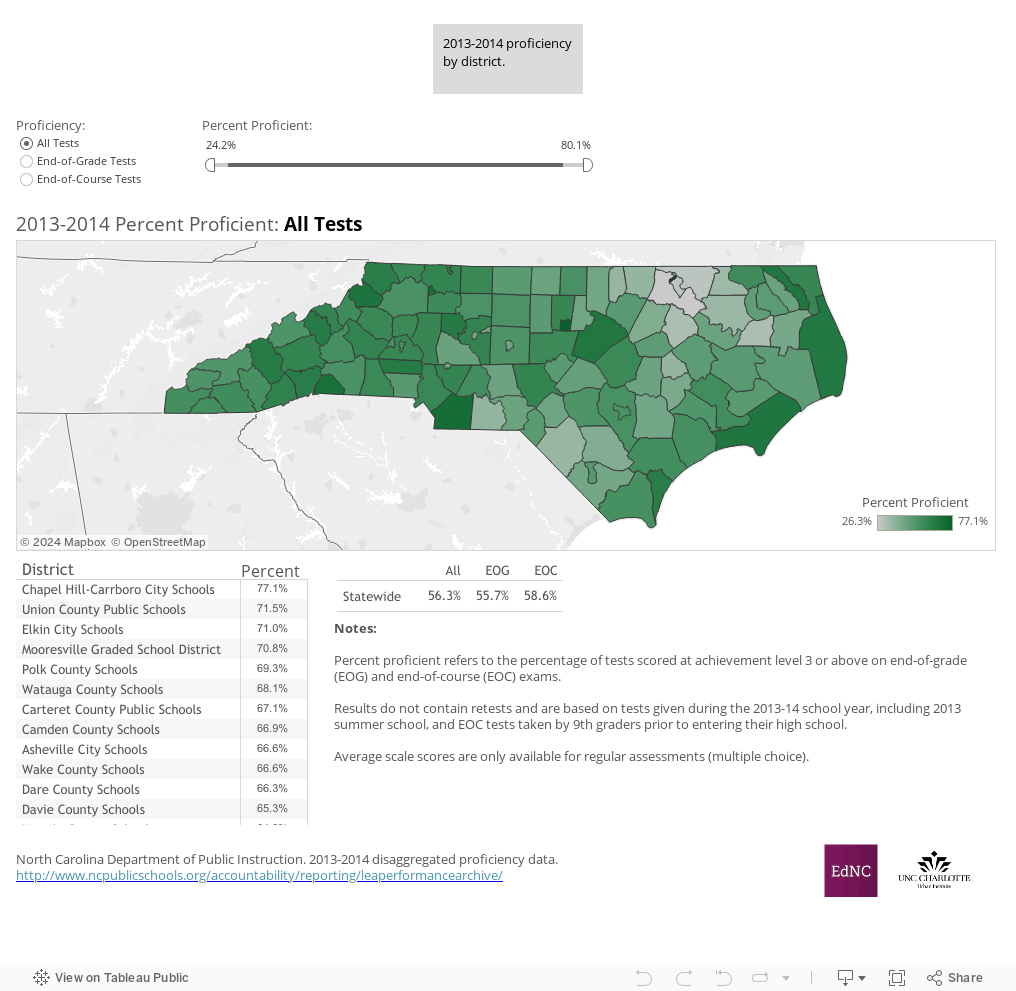
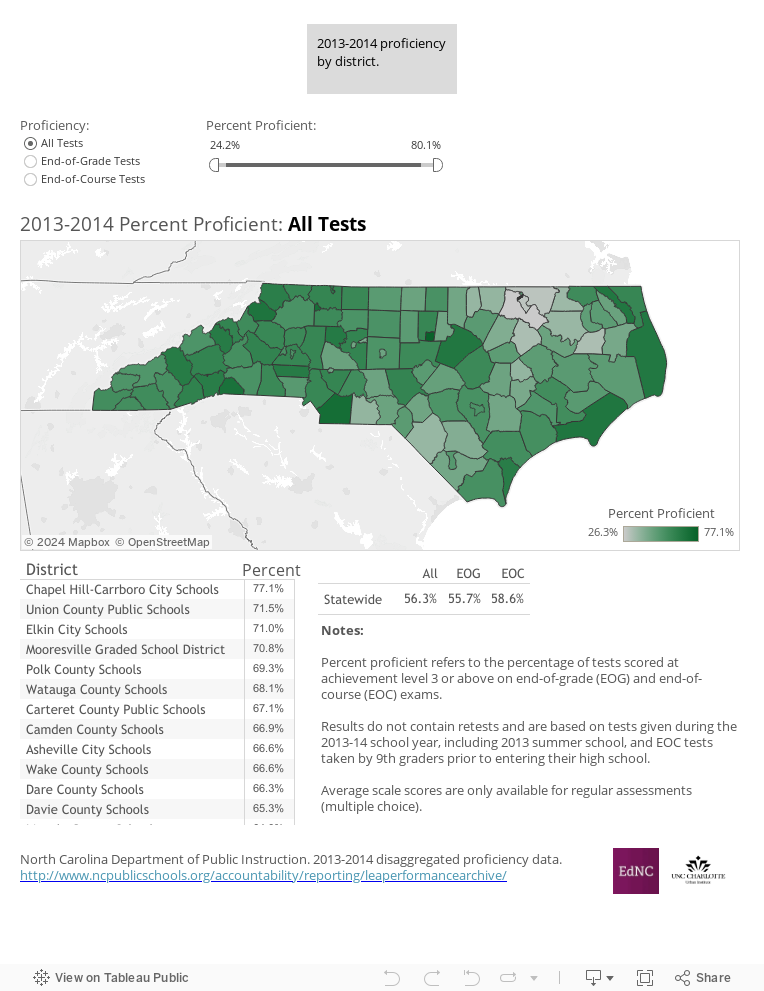
This week’s map looks at the newest proficiency data for school districts for end-of-grade (EOG) and end-of-course (EOC) exams. EOG proficiency rates reflect the share of all end-of-grade tests taken (3rd-8th for reading and math, 5th-8th for science) that were scored proficient. EOC proficiency rates are the percent of all end-of-course tests taken (in Math I, Biology, and English II) that were proficient. The overall proficiency rates are the percent of all EOG and EOC tests taken and scored as proficient.
In comparing the 2013-14 data to previous years, it is important to note that the definition of “proficient” has changed. In 2012-13, test scores were grouped into 4 achievement levels, with the top two (levels 3 and 4) considered proficient. In 2013-14, the number of achievement levels increased to 5, and the top 3 (3, 4, and 5) are proficient.
The data in the table below the map lists the percent proficient in descending order for all school districts in the state. Choose an exam test type from the list above the map to view all tests or EOGs and EOCs separately.
A few observations about the data:
- Districts in the northeast region of the state had lower proficiency rates.
- Chapel Hill-Carrboro school district had the highest proficiency rates.
- 44 school districts had proficiency rates below 50%.
- 3 school districts had EOG proficiency rates greater than 70% and 8 school districts had EOC proficiency rates greater than 70%.
About the author