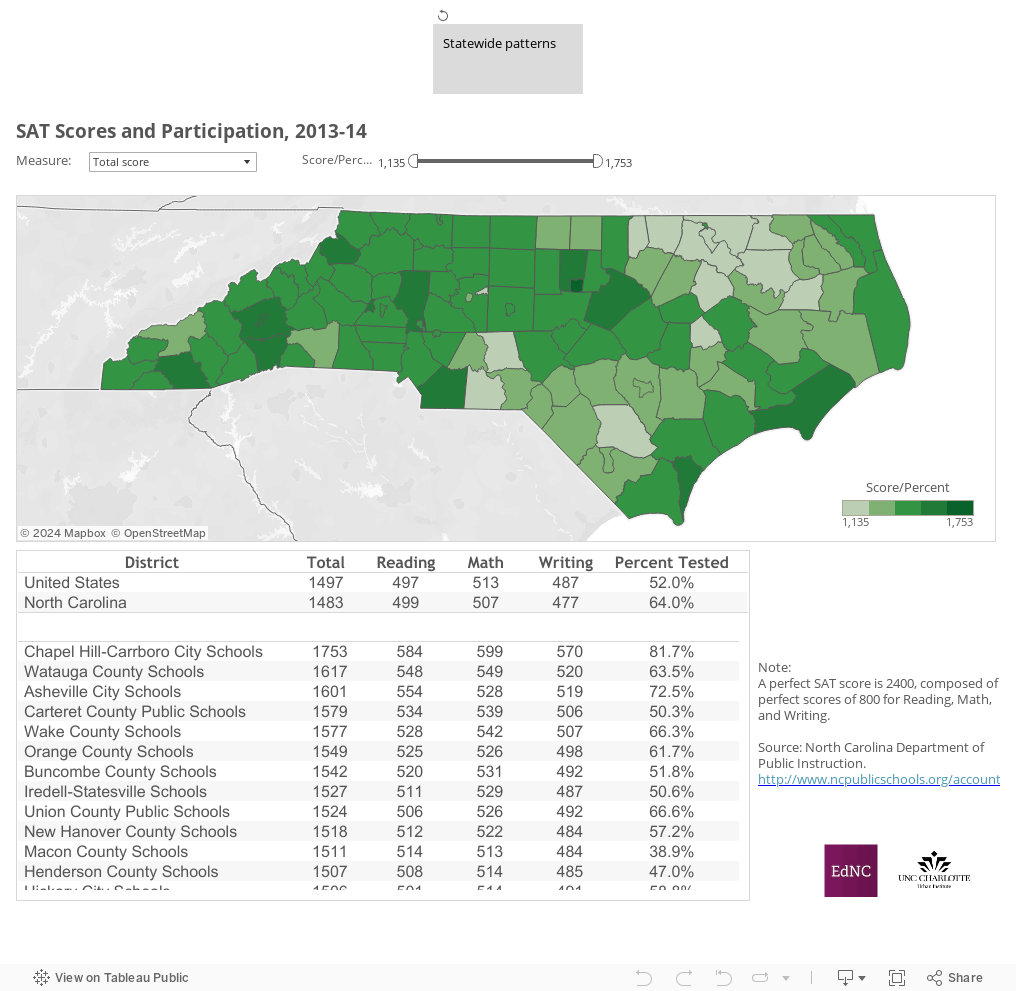
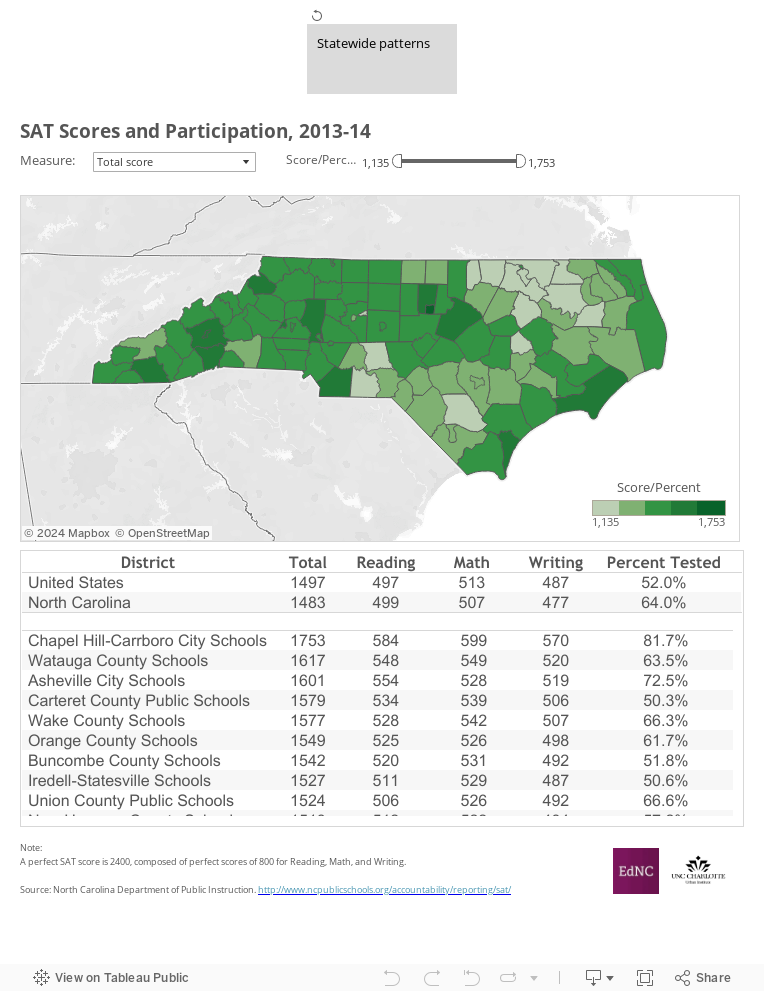
This week’s map looks at SAT scores and participation in 2013-14. The SAT exam measures the critical reading, math, and writing abilities of students, providing critical measures of college readiness. Choose a test component or the percent of students who took the SAT exam from the dropdown menu above the map. All of the numbers are also provided in the table below.
A few observations about the data:
- Statewide, 64 percent of students took the SAT exam, well above the national average (52 percent).
- Ten districts had participation rates higher than the state average.
- Four districts had at least 70 percent of students take the SAT exam, while 8 districts reported less than 30 percent of students taking the SAT exam.
- North Carolina students were on par with the national average in reading, but scored below the national average in math and writing.
- Chapel Hill-Carrboro City Schools’ students had the highest average score (1753) and the highest percent of students who took the exam (81.7 percent).
- Halifax, Northampton and other northeastern districts near the Virginia border had generally lower average SAT scores, but reported higher than average rates of participation.
About the author