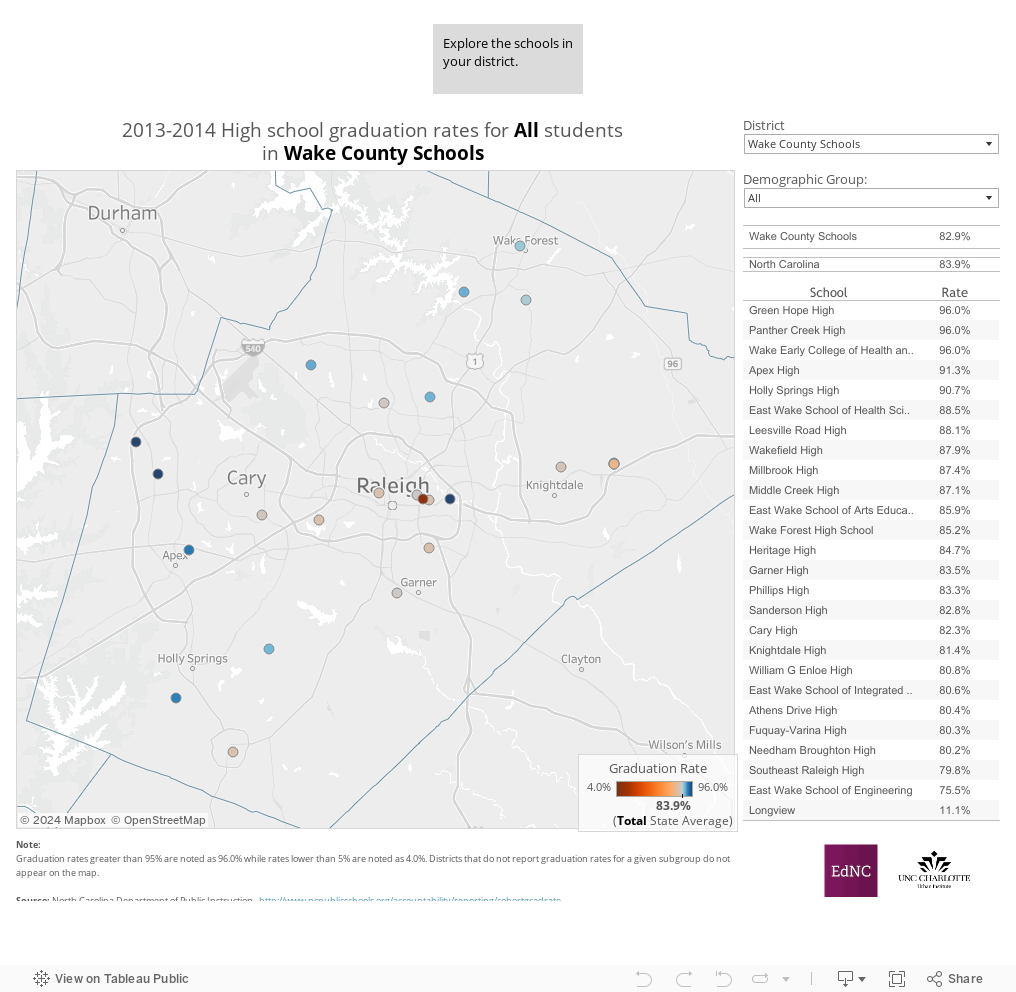
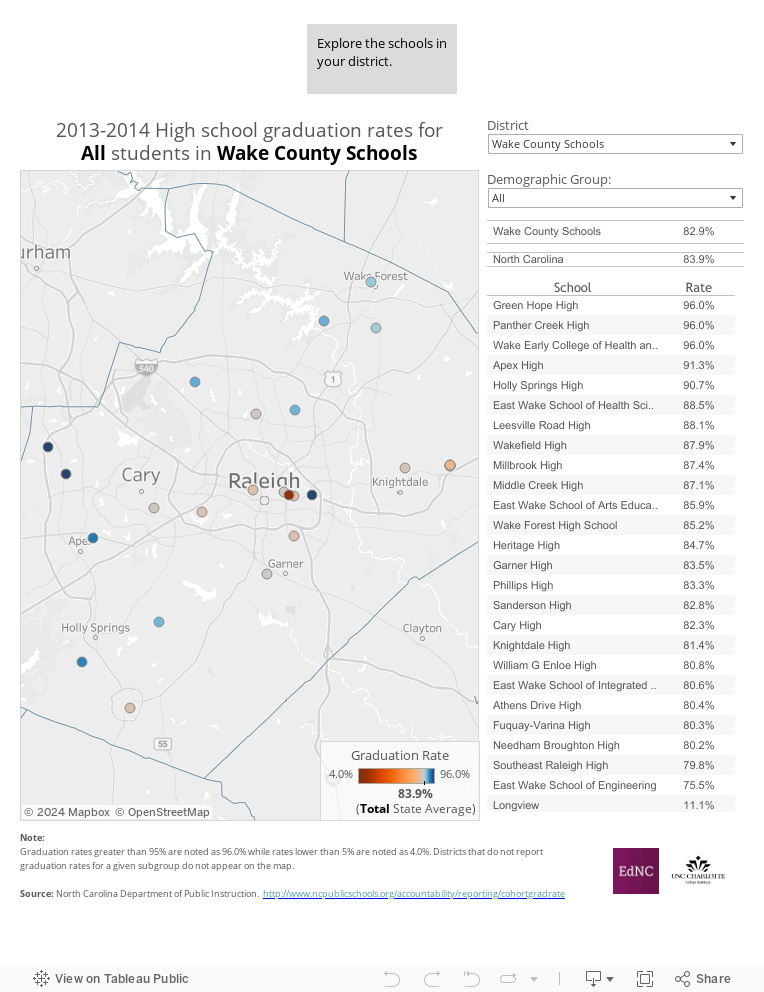
This week’s map shows high school graduation rates at the school level and presents the latest numbers for various demographic groups.
Choose a district and demographic group from the menu to the right of the map to see the rates for students of a particular race/ethnicity, sex, socio-economic status, English proficiency, or gifted status. Schools in blue are above the state average for all students (83.9 percent), and those in orange are below. For a full list of all high schools in the district, see the table to the right of the map.
About the author