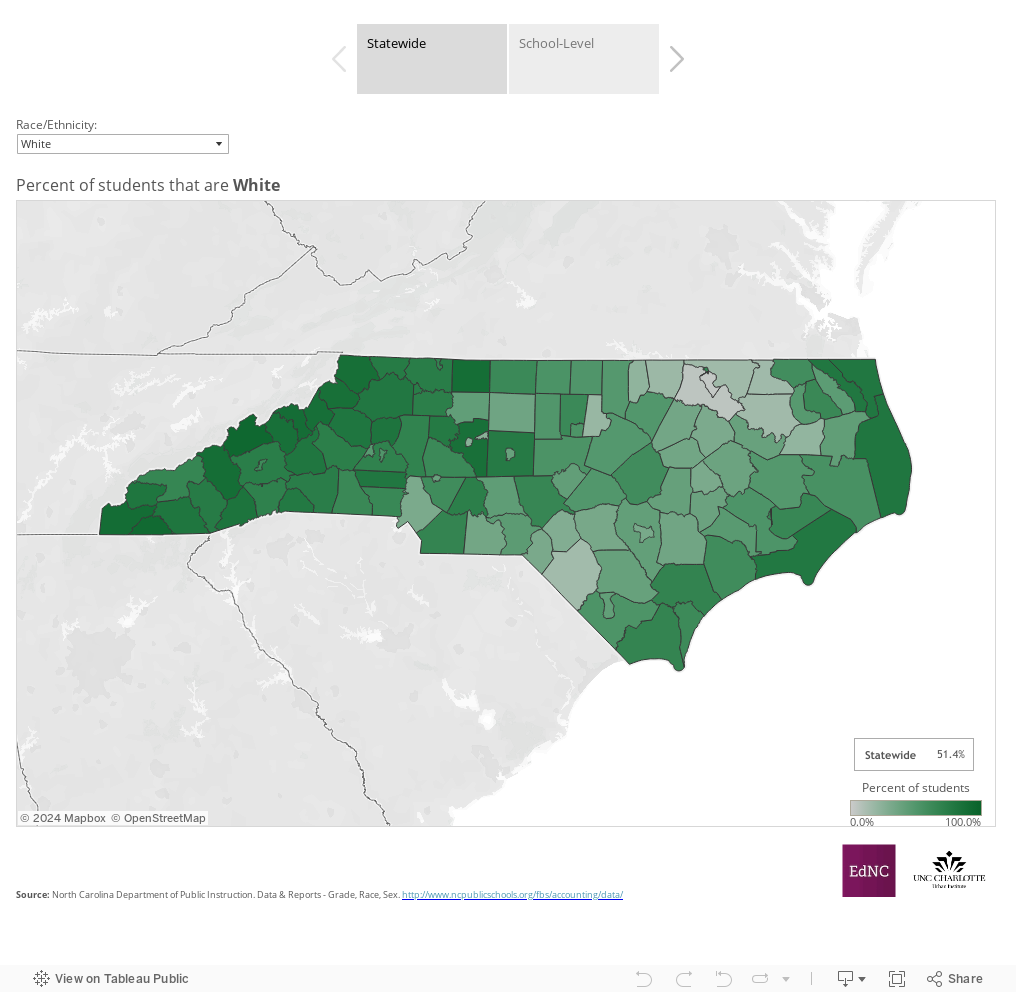
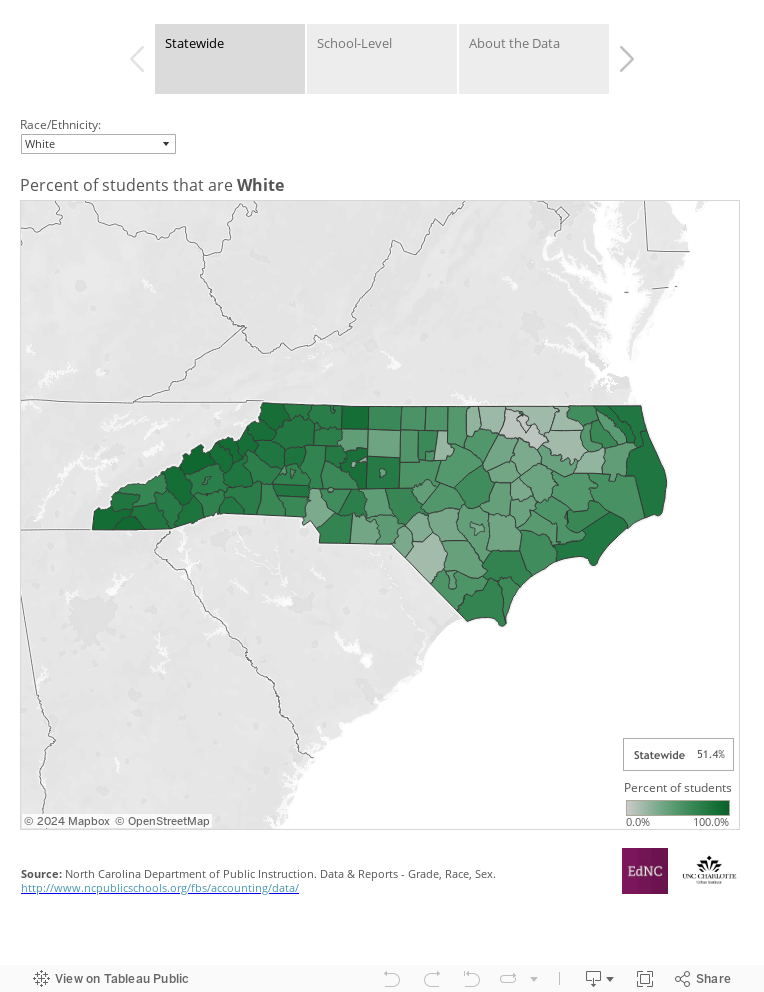
This week’s maps look at the demographics of students during the 2013-14 school year. The maps show students by race or ethnicity as a percentage of the total student population. The first tab looks at the district level.
Although white students account for a little over half of all students in the state, white students make up the majority in only half of the state’s school districts. Districts in the mountain region have the highest percentages, and white students account for around 90 percent of all students in several districts.
African American students are the second largest group statewide, making up 26 percent of students. The largest percentages of African American students are found in the northeastern part of the state, near the Virginia border, where African American students account for over 70 percent of students in several districts.
Hispanic or Latino students account for nearly 15 percent of students statewide and are distributed more evenly throughout the state than white and African American students. Duplin, Sampson, Lee, and Montgomery counties have the highest percentages of Hispanic or Latino students (over 30 percent).
The second tab at the top allows you to view the demographics of students at the school level. The map shows one racial/ethnic group, and the chart shows the complete breakdown for each school. Choose a school district using the dropdown menu above the map and a racial/ethnic group using the second dropdown menu. Click on a school on the map to highlight it on the chart.
About the author