This week the maps look at the percent of students at the district level applying for free and reduced lunch. Students are identified as economically disadvantaged through their application for the federal meal program, so these terms are used interchangeably in previous maps looking at student proficiency. For students to be eligible to receive free or reduced lunch, the household where they reside must fall within the guidelines set by Child Nutrition Programs. Note that data is only available for students who applied to receive free and reduced lunch.
The most up to date guidelines for 2014-15 are shown in the About the Data tab. The income eligibility guidelines for free and reduced lunch are based on the Federal Poverty Guidelines.
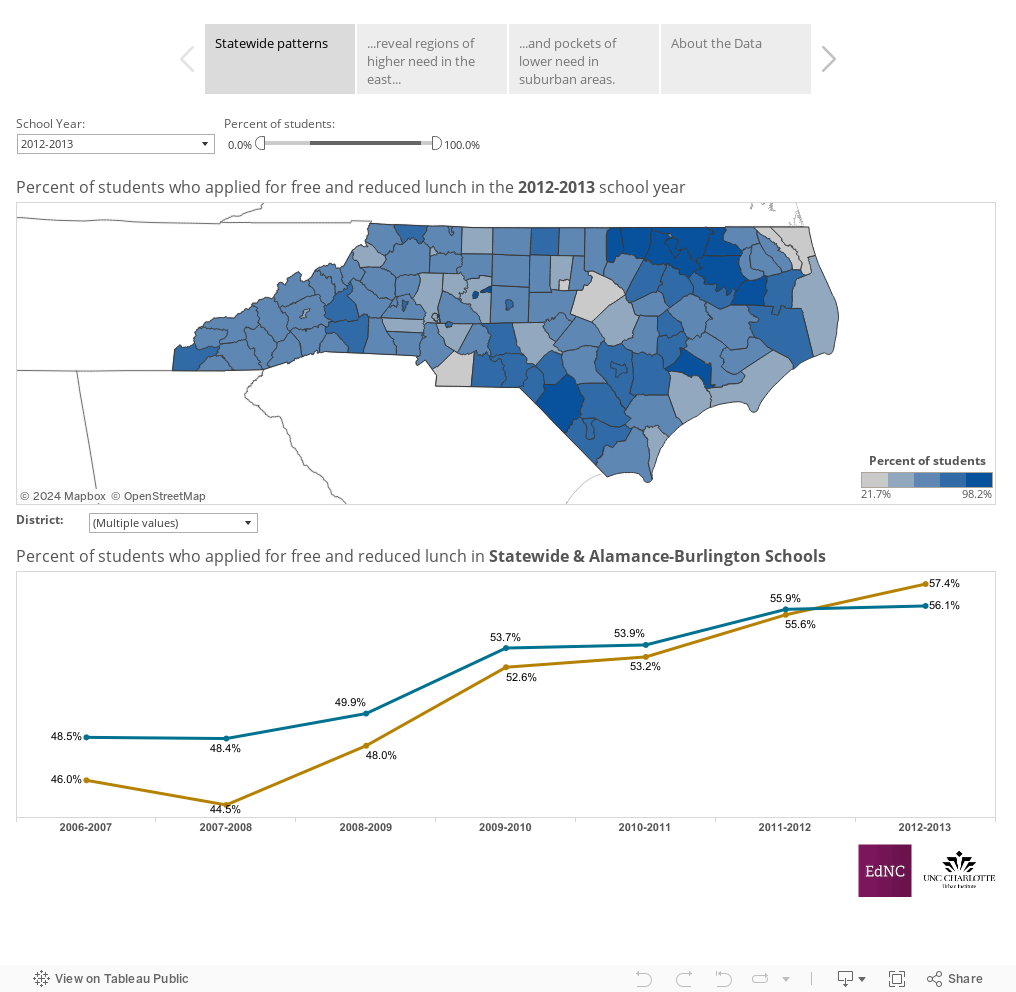
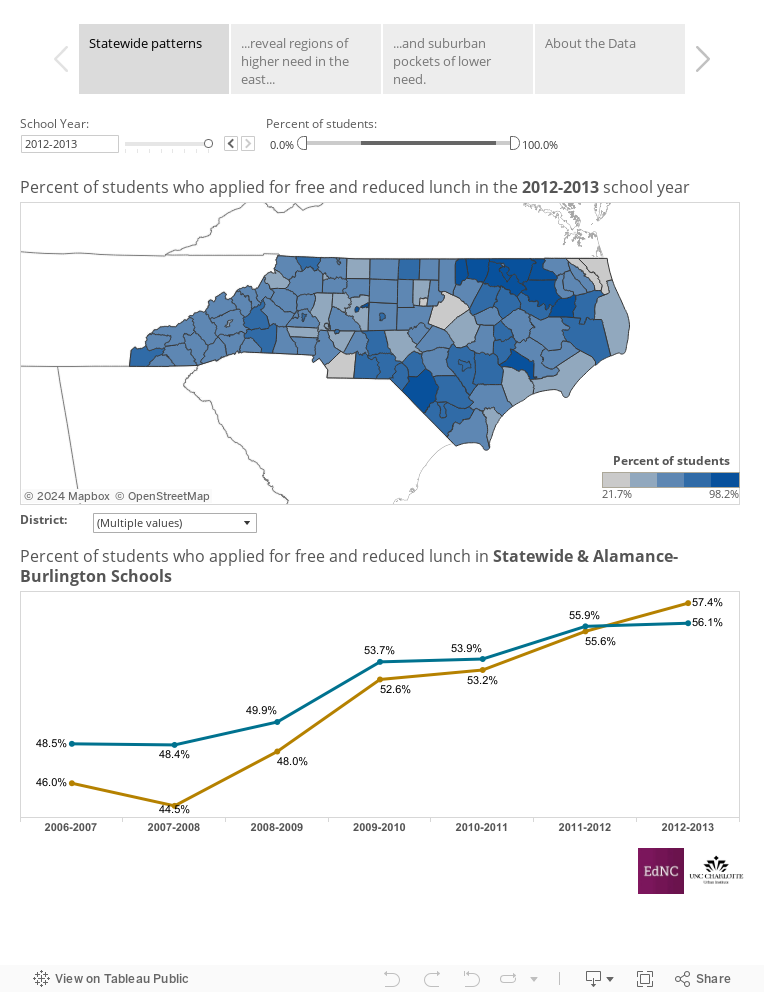
Ninety-five percent school districts experienced an increase in the percent of students applying for free and reduced lunch from 2006-07 to 2012-13. This is similar to the increase that has occurred at the state level over this time. Of the five percent of school districts that did not see an increase in the percent of students applying for free and reduced lunch, the percent applying was a slight decline or remained stable.
To dive deeper into the data, select districts you would like to compare to the state over time on the chart below. You can choose multiple school districts from the drop down button to see how the percent of students has changed over time. If you want to see data on one district you can also click on the map to view this data. Note the blue line on the chart is the state level data and the districts you choose will be in different colors. You can scroll over the data on the chart to see which line represents each district. Clicking on a data point on a line will shift the map to reflect the statewide patterns during that school year selected. Alternately, you can use the arrows to the right of the school year at the top of the dashboard.
The second tab allows you to view school districts with 80% or more of students who applied for free and reduced lunch. The map illustrates the cluster of districts in the northeastern portion of the state, which in recent years saw an 80% or more of students apply for free and reduced lunch. Two other areas where 80% or more of students have applied for free and reduced lunch occur in districts along the southeastern border of the state with South Carolina and the urban districts of Davidson County.
You can view the school districts that had less than 40% of students apply for free and reduced lunch in the third tab. These school districts are scattered throughout the state and include more suburban districts such as Union County, Wake County and Chapel Hill-Carrboro schools as well as Currituck County and Camden County schools. Click on the school district to see how the percent of students who applied for free and reduced lunch has changed over the past seven school years.
About the author