This week the maps take a closer look at free and reduce lunch applicants for elementary schools. While students who apply for free and reduced lunch are often grouped together, there is a significant difference in the percent of free lunch applicants compared to reduced lunch applicants in many schools throughout the state. These maps illustrate the locations of free lunch applicants and reduced lunch applicants separately to allow users to visualize these differences.
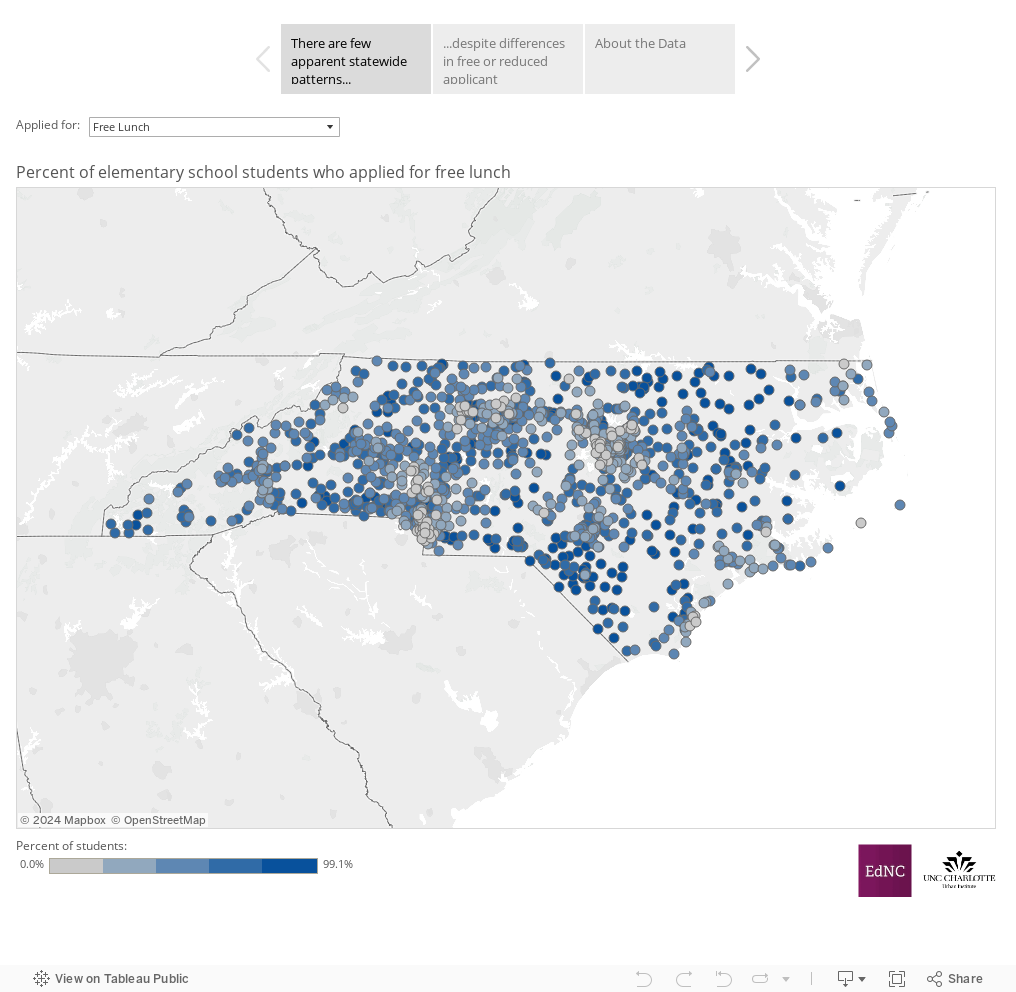
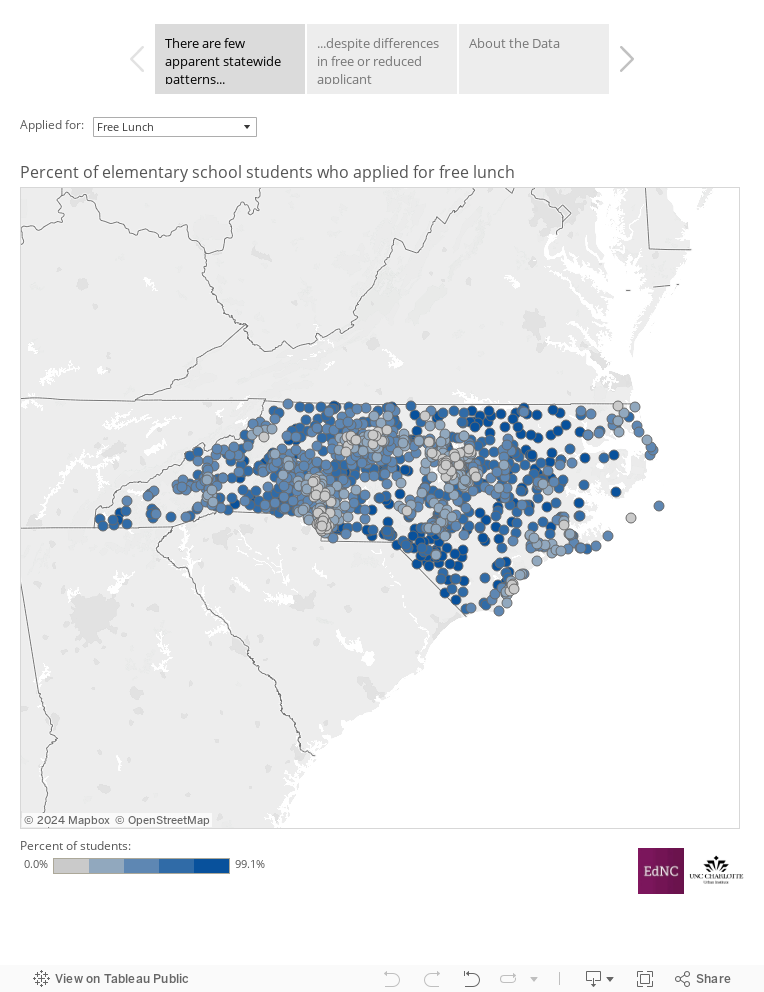
The Statewide tab allows you to view the percent of free lunch applicants at the school level across the state. Schools with high percentages of free lunch applicants are scattered throughout the state but are more concentrated in the southeast and northeast regions of North Carolina. In contrast, areas with few free lunch applicants are more concentrated near urban centers in the Charlotte region, Guilford County, the Triangle area and along the coast in New Hanover County.
The dropdown menu above the map allows you to view reduced lunch applicants. This map shows that reduced lunch applicants at the school level make up much smaller percentages of applicants compared to free lunch applicants. There is no distinct pattern regarding the concentration of reduced lunch applications.
To view schools for a district, click on the second tab. The map provides the percentage of free and reduced lunch applicants and the chart illustrates the composition of free reduced lunch applicants. Selecting a school on the map or chart will highlight its location and display the exact percentage of free or reduced lunch applicants from the total percentage of both in a school. As you look at schools at the district level, note that the vast majority of applicants apply for free lunch rather reduced lunch.
About the author