Testing is a big topic in education today. One way to make sense of the result of modern testing of students is to map it. The interactive maps presented here allow you to see student data by school.
Most of the state’s non-charter public schools are available in the tool, but you won’t see all schools in any given map display. When you select a grade, you should see schools across North Carolina that teach that grade. You will need to match subjects and grades to get results in the map. Testing is different for high school students than for those in elementary and middle grades. Read the notes on the data tool to see how to match these up correctly.
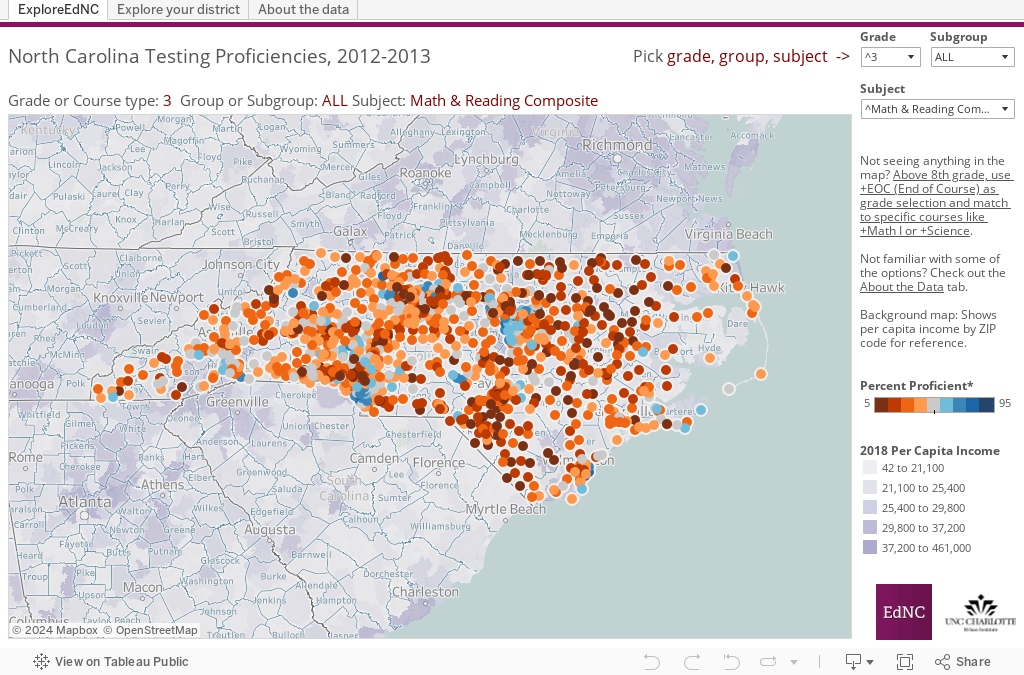
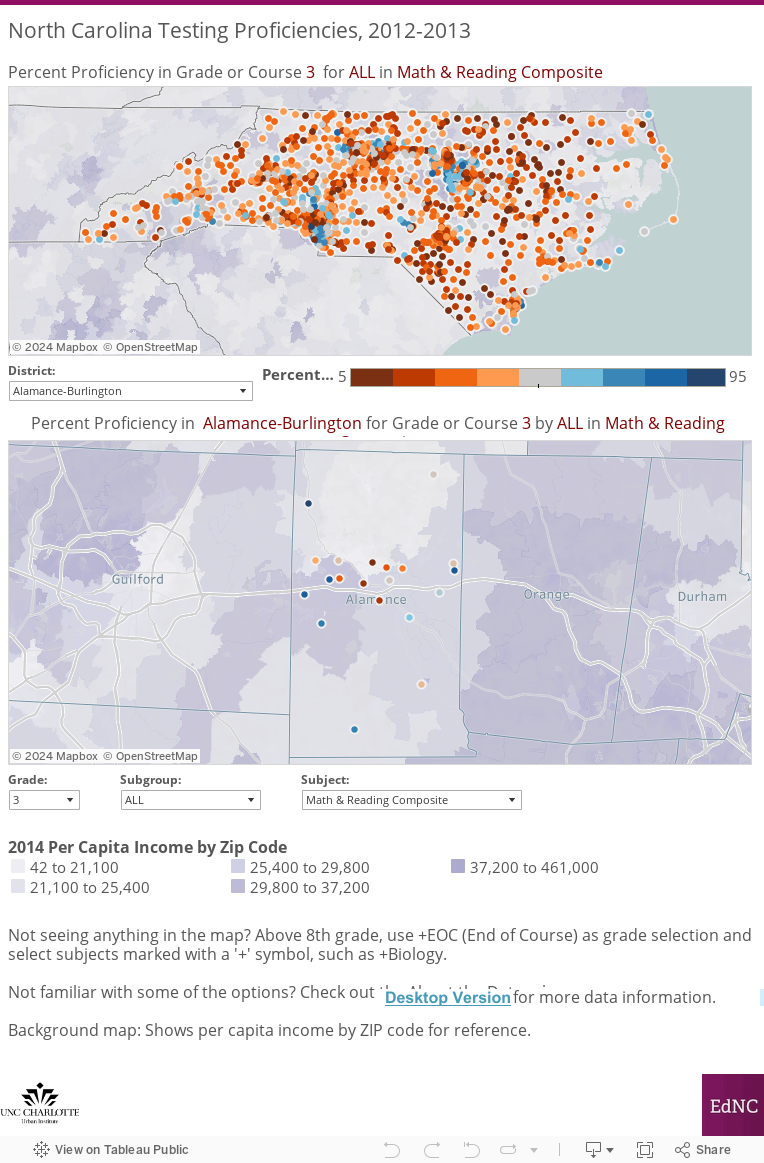
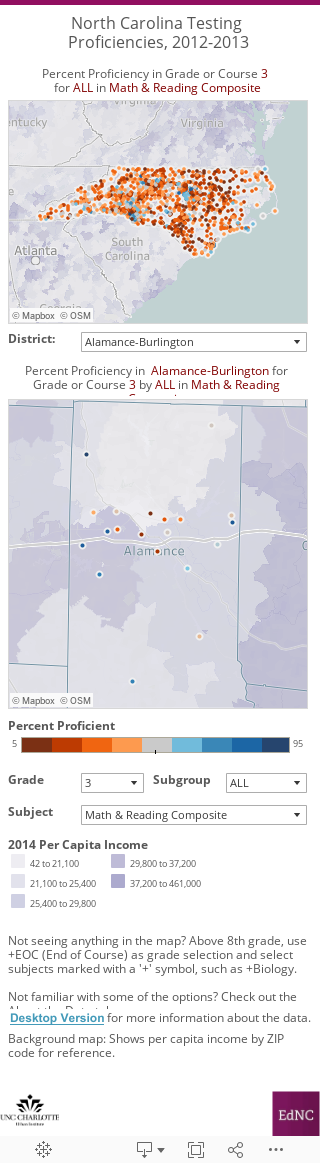
The default view of the map shows third grade proficiency scores combining math and reading. Higher scores are in shades of blue. Notice how well the schools in blue line up with higher income areas of the state (the background shading shows income).
Take time to explore the map options. The “Subgroup” option lets you see how various groups of students compare. See the “About the data” tab for more explanation of the subgroup abbreviations.
We did our best to locate all public schools correctly. Let us know if you see a location problem or a school is missing. Keep in mind that not all scores are available for all subgroups. If a very small number of students fall into a particular category, then the state does not release data for that small group. The state also does not give specific school averages below 5 percent or above 95 percent. When you see averages of 4.99 or 95.1 that indicates a score of < 5 percent or > 95 percent.
About the author