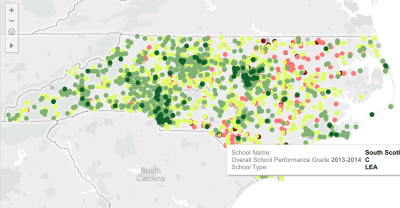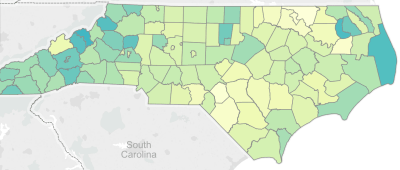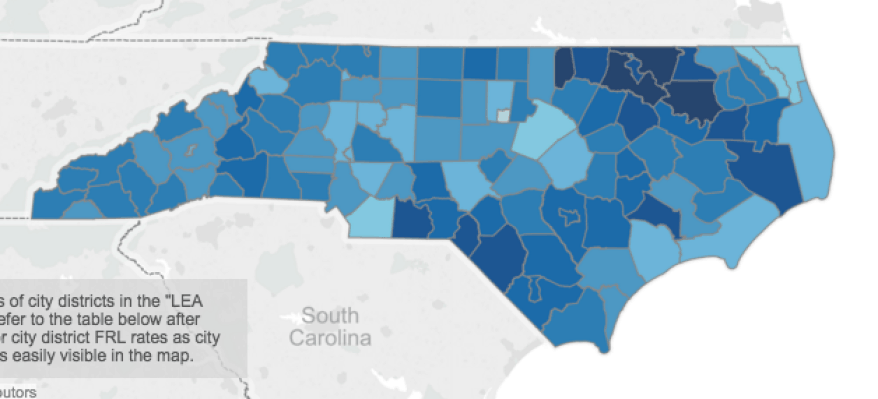
The proportion of students in a school who opt into the federally-funded National School Lunch Program (NSLP) to receive free or reduced-priced lunches (FRL) has long been used as a proxy for poverty in North Carolina and most other states. Many education leaders and researchers (including me) have grown so accustomed to using this measure that it is sometimes easy to forget that FRL rates and poverty are not exactly the same thing (see maps in the second tab, above). This month’s maps show the historical trajectories of FRL rates by school district over time, as well as a comparison of the most recent FRL rates with county-level poverty rates as calculated by the U.S. Census.

Recommended reading