The state released its latest round of school performance grades last month. The annual event is heavily covered by the media and discussed by educators, policymakers, and parents.
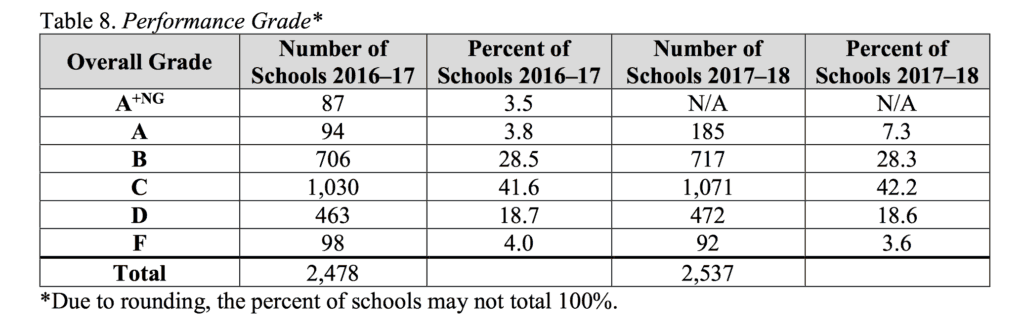
Just to recap, this year 7.3 percent of the state’s 2,537 schools received an A, 28.3 percent received a B, 41.2 percent received a C, 18.6 percent received a D, and 3.6 percent received an F. That includes charter and traditional public schools.
School performance grades mean one thing to journalists: a story. They mean something else for state education leaders and legislators. For educators — teachers, principals, and superintendents — they mean still something else.
But what do they mean for parents? What about parents whose kids aren’t in school, but soon will be?
I recently had the opportunity to get an answer to that last question first-hand. My nephew just turned two in August. My sister, who lives downtown, is considering moving elsewhere in Raleigh, and as her child gets older, schools are a consideration when deciding where to live.
Knowing what I do for a living, she mentioned to me where she was considering moving and asked me about the schools in the area. I told her we should look them up on the state’s school performance grade website. That’s where things got tricky.
She asked me about a specific school by name. I looked it up and saw that it had a B. She made a face. She was hoping for a school with an A. What parent wouldn’t? But I explained to her that it was more complicated than that.
I started by telling her about how the school performance grade is calculated: 80 percent academic performance and 20 percent academic growth.
Just a brief primer. Academic performance basically measures how well students do on standardized tests such as the end-of-grade and end-of-course tests. Academic growth measures how much students learn in a particular year.
I explained to my sister that the grade was heavily weighted towards performance, meaning that the state was largely measuring how students do on these standardized tests. I further told her that a student’s performance on these tests can be attributed to many factors beyond simply the education a student receives: socio-economic status, whether the student was on grade level when he or she entered the grade, life circumstances, how they might have felt on the day of the test, etc. I also told her that academic growth was what measured how much a student was learning in a year.
Fortunately, the school performance grades also include that as a breakout statistic. The school we were looking at did not meet growth, but it was just on the border between not met and met growth. So, I also explained that to her.
The school report card website also includes a lot more information, all of which we discussed. We reviewed how well students fared on standardized tests in different subject areas, and how they compared to other students in the district and the state (they fared similarly).
We looked at the makeup of the teachers — their numbers, their licensure, their advanced degrees, their turnover rate, their teaching experience, etc.
And at the end of it all, she felt a little better, but was still unsure.
And then I explained to her that she had to understand that everything we were talking about on the report card was aggregated data. The teacher her son had would make all the difference. Some teachers in the school had students who performed better academically than the school as a whole. Some teachers had students who grew more in the school year than the majority.
The fact of the matter is that the school performance grade was taking a 10,000 foot view of a school population when all she cared about was how her son would do.
So, I told her that the school’s grade might not tell her anything about that. Many of the things that make a good school a good fit for a student — or a parent — can’t be captured on a report card.
And the bigger takeaway I took from the experience was that, left to her own devices, my sister would likely have been unable to parse the metrics of the school performance grades and make an informed decision about what to do. She needed an interpreter. In this case, me.
So, what does all that say about the school performance grades? Perhaps it means that we, as a state, need to get a better handle on what we think the school performance grades mean. Are they an instrument to inform policy? Are they a tool to help parents make good choices? Are they both? Are they something else altogether?
But the larger question, once we’ve answered the ones above is: are they designed in such a way that they actually help accomplish whatever goal we’re aiming for?
If they are supposed to be a tool to help parents make a good choice, and my sister needs an interpreter to understand the school performance grades, then that might be a problem.
These are all things that the U.S. Department of Education is considering in the wake of ESSA. They’re holding an event to help state’s think about how to design family-friendly school report cards. The event is in November. Read about it here.
Here is more good news, EdNC’s interactive map of school performance grades will be ready soon! Stay tuned.
What to watch for this week
On Tuesday, the General Assembly is holding a special session to address the aftermath of Hurricane Florence. This session will likely be heavily focused on education as many districts have schools that are damaged and students who have and will continue to miss long periods of schools. Calendar flexibility will come up to help districts facing missed school days, some missed days will be forgiven, and, of course, money will be allocated to help disaster areas.
On Wednesday and Thursday, the State Board of Education meets. The Board will hear an overview of Hurricane Florence’s impact on North Carolina public schools. They will also get an update on efforts to identify more schools to join the Innovative School District next year. So far, one school, Southside Ashpole in Robeson County, has joined the ISD — and at least two more are expected to be chosen this year to start next year. See the full agenda for the State Board here.

Recommended reading