American Indian Education
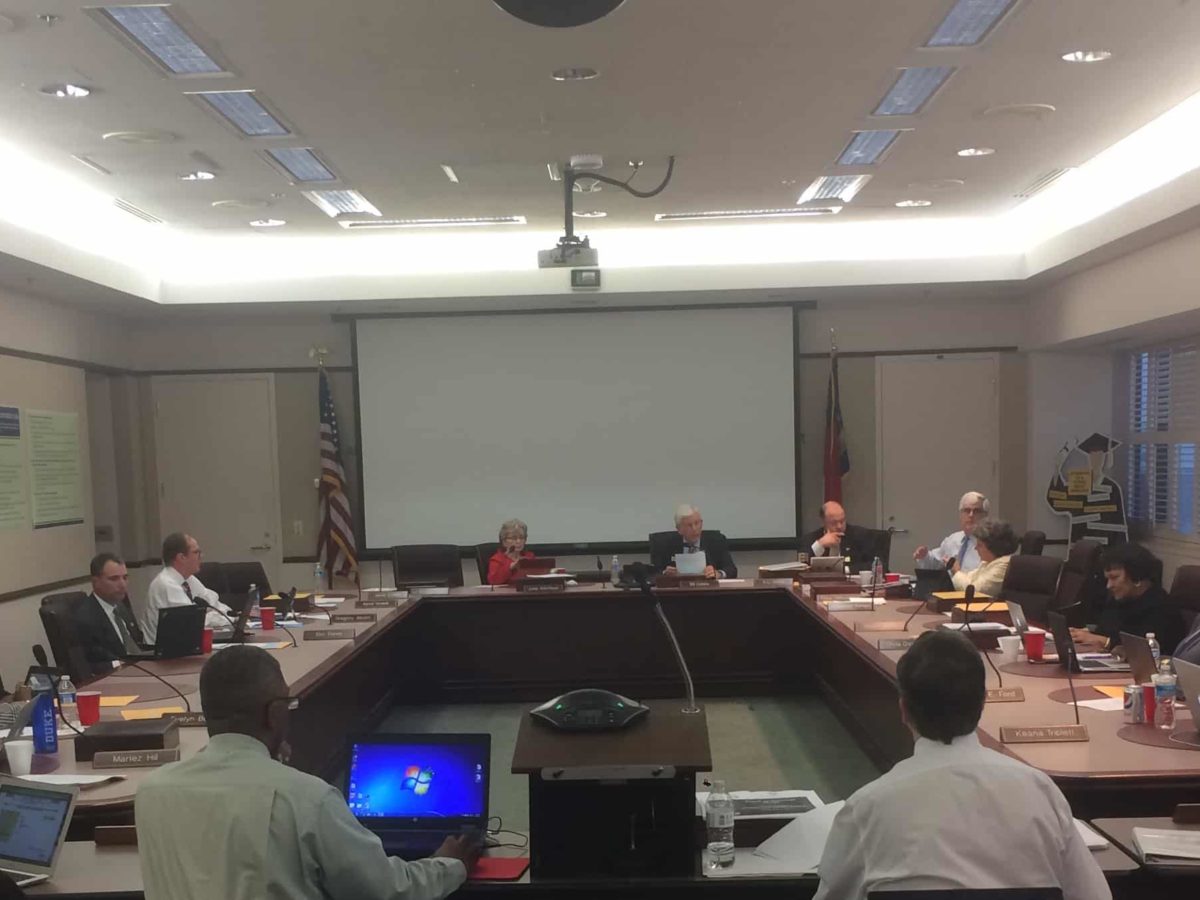
American Indian students in North Carolina are not faring as well as their peers, according to a report presented to the State Board of Education Wednesday.
The report, “The Experience of North Carolina’s American Indian Students,” was put together by University of North Carolina at Chapel Hill and Florida State University researchers.
Their findings show that American Indian students miss more days of school, are more likely to receive free-and-reduced price lunch, and are less likely to be identified as academically gifted when compared to peers statewide.
And performance on standardized tests is an issue as well.
“American Indian students perform well below the state average on all of these tests,” UNC researcher Sarah Fuller said of students in grades 6-12.
In 2013-14, North Carolina schools had 20,500 American Indian students according to the presentation. But the majority — 81.4 percent — are in 17 districts and 1 charter school. The largest concentration of American Indian students is in Robeson County, where more than 40 percent of students identify as such. Swain County has the second largest population, with more than 20 percent American Indian students.
The varied concentration of American Indian students has implications for districts, Fuller said.
“Those are much larger concentrations of students, so that’s going to impact how districts are able to work with the students,” she said.
Statewide, 70.1 percent of American Indian students qualify for free-and-reduced price lunch, compared to 49.7 percent of the non-American Indian population. Within schools, however, the American Indian population isn’t so different from its peers. The percentage of non-American Indian students eligible for free-and-reduced price lunch within the same schools is 71.8 percent.
Similarly, American Indian students compare poorly statewide to their peers when it comes to being identified as academically gifted. Ten percent of American Indians and 17.4 percent of non-American Indians receive that designation respectively. But within schools with American Indian students, the group compares more favorably to its peers — 11 percent of whom get the academically gifted label.
This also holds true for things like performance and percent of students who receive suspensions. American Indians lag behind their peers statewide, but are similar to non-American Indian students within the same schools.
“So these are schools that are struggling overall,” Fuller said.
Regardless, not all of the American Indian students’ problems can be attributed to struggling schools, Davis said.
“There is also an additional gap that seems to be unique to that student population,” she said.
When it comes to graduation rates, for example, American Indian students lag behind peers both within the same schools and statewide. The graduation rate is 79.9 percent for American Indian students, compared to 83.9 percent for non-American Indian students within the same schools and 84.2 percent for non-American Indian students statewide.
As to what can be done to address the gaps, Fuller’s colleague at UNC, Cassandra Davis, said that one factor missing is culturally appropriate instruction. She said that having curriculum that reflects the students helps them connect more with their education
“Across the board, the solution or one of the solutions was definitely making sure that this population was more engaged,” she said.
Teachers Leaving the Profession
The State Board briefly took up the recent turnover report released by the state Department of Public Instruction. As we’ve reported, there were some issues with the report, including inaccurate comparisons of data.
The report was being brought to the Board for approval before being sent along to the General Assembly. Board member Olivia Oxendine said that changes will be made before legislators received the report.
“As with any report that’s chock-full of data… the department needs to go back and verify some categories of information,” she said in an interview during a break in the meeting.
In particular, she cited numbers for Teach for America as one area that needed to be checked. She said that because of the wide variety of people collecting the data, it’s important to make sure everything is right.
“Being the researcher that I am anyway, I want to make sure all the data are accurate and confirmed,” she said.
During the meeting, Chairman Bill Cobey called out the title of the report, in particular, for criticism.
“This report is mislabeled,” he said. “It’s called ‘Teachers leaving the profession,’ and we know that’s not true.”
Contained in the report are other categories, including teachers switching jobs between districts and states, and teachers who remain in education but in different positions.
The Board approved the report Thursday with changes that will be reflected in a new version to be posted online.
Charter School Revisions
The Charter School Advisory Board recommended to the State Board weakening the policy regarding revocation of a school’s charter, and the State Board took up the revision Wednesday.
Currently, the State Board can start revocation if a school does not meet or exceed growth and has proficiency lower than 60 percent for two or three years in a row.
The Advisory Board recommended that the school should be operational for five years before those provisions kick in. It also says the State Board should have more options than just revocation.
The options include launching a competitive bid process to have someone else take over the school, requiring the school to come up with an improvement plan, taking no action or, more vaguely, taking “any other action deemed appropriate in the discretion of the State Board of Education.”
The Board will likely vote on the policy revision at next month’s meeting.
Testing Proof-of-Concept
The first interim assessment under the proof-of-concept study of new testing changes ended October 30th. In presenting the update to the State Board Thursday, Dr. Tammy Howard, director of Accountability Services at DPI, said that so far, the study appears to be going well.
“We have not heard anything strongly negative,” she said. “We are always clearly informed when things are not going well.”
Howard said the state’s expectation was that teachers would have received the results within five days, but since the tests were scored locally, the results could have been available earlier depending on the district.
“Theoretically, the teachers could have had the results as early as that afternoon or the next day,” Howard said.
Learn more about the study here and here.
Recommended reading