
Data about North Carolina’s students, teachers, classrooms, schools, and districts are woven into almost every discussion and debate about education across the state. From teacher pay to class size to test scores to school report cards — teachers, administrators, parents, researchers, and policymakers depend on these data to implement changes in their schools and classrooms, learn about the quality of their students’ education, and craft data-informed policies, among other things.
With 115 school districts (LEAs), 58 community colleges, and 17 UNC System institutions, there is a lot of North Carolina education data to collect, manage, and analyze. Beyond fulfilling state and federal reporting requirements, these data serve as a resource for educators, administrators, and legislators across the state seeking to improve educational services and student outcomes. Good data can help answer tough questions like: How should I differentiate instruction to best meet my students needs? What is the optimal cap on class size for K-3 classrooms? What aspects of an educator preparation program are essential for developing effective teachers?
But before data can be leveraged to answer those questions, it has to be collected, processed, checked for errors, plugged into various equations, and more. Behind the clean-cut reports on education data that we consume is an entire web of data systems — sometimes interconnected, sometimes siloed — working to provide insight on our state’s students.
Between the acronyms and the jargon, what is the current landscape of education data systems in North Carolina? How does each system collect and process data on its students? What types of data are those systems collecting? How do those systems interface with one another? Let’s take a look, beginning with K-12 schools.

The North Carolina Department of Pubic Instruction (DPI) Division of Enterprise Data and Reporting works to provide data and research findings to internal and external stakeholders of DPI. Under the direction of Enterprise Data Manager Karl Pond, DPI collects a variety of data on the students, teachers, and schools from the 115 Local Education Agencies (LEAs) across the state and from public charter schools for use in state and federal reporting, as well as internal decision-making. While not an exhaustive list, examples of data reported by DPI include:
- Student demographic and academic data: enrollment by year, academic level, course, ethnicity, and gender are available on the Statistical Profile Online; graduation rates; dropout reports
- Student testing data: end-of-grade and end-of-course scores, ACT and ACT WorkKeys scores, SAT scores, performance indicators for Career and Technical Education students
- Student behavior data: attendance counts, discipline data
- HR data: Teacher experience, teacher licensure, teacher race and ethnicity
- Financial data: budget data, annual expenditures for each LEA, and charter school membership can be found here
Much of this data flows from individual schools to the 115 LEAs and then ultimately to the state. What does this process look like? When a student — for this example, let’s call her Emily — registers at a public school in North Carolina, the school enters Emily’s information (i.e., name, gender, date of birth) into a Unique Statewide Identifier (UID) System to see if school records for Emily already exist elsewhere. Since Emily attended kindergarten in Florida, there’s no previous record of her in the UID system when she arrives to register for first grade in Buncombe County. In this scenario, Emily is assigned a new student UID that will now travel with her records as she progresses through K-12 and higher education in North Carolina.
If, however, Emily attended kindergarten in Wake County, she would be matched with her previously assigned UID when she enrolls in first grade in Buncombe County. This UID system matches any student record that is a 94 to 100 percent match with a previously existing record, thus enabling the matching of student-level records across time and location. Additionally, all staff who work in the North Carolina public schools system receive a staff UID that enables the tracking of their records over time. A certain level of anonymity and privacy is ensured by using UIDs rather than names or social security numbers.
According to Pond, all student information is logged in PowerSchool, the state’s student information system. As Emily progresses through first grade, any additional information her elementary school collects about her goes into PowerSchool. For example, if Emily is identified as an English Learner (EL) or is granted any testing accommodations, these data are entered into PowerSchool. The data in PowerSchool from every school in the district then roll up to the LEA or charter-level PowerSchool data store.
From there, LEA and charter school-level data rolls into the state-level PowerSchool data store. According to Pond, while all of North Carolina’s 115 districts and 185 charter schools use PowerSchool, any LEA or charter school may use other third-party systems to collect student-level data. The data collected by those systems is integrated with the LEA or charter’s PowerSchool and, as a result, rolls up to the state-level data store in the same way. DPI uses this state-level data store for a variety of reporting, including the creation of files that enter longitudinal data systems, allowing the state to track cohorts of students over time. More on that later in the NC SchoolWorks section of this article.
School report cards
Each year, DPI compiles many of the data previously discussed into school report cards that are published on an online platform hosted by SAS. These school report cards serve as the main accountability tool for NC public schools and include a wide variety of data on every school and district across the state, from student proficiency in different subject areas to teacher qualifications. One aspect of school report cards is the school performance grade assigned to each school, ranging from A to F, which is calculated using a formula that includes 80 percent academic achievement and 20 percent academic growth.
Academic achievement measures how well students do on end-of-grade and end-of-course tests at a single point of time. Beginning in third grade, students take mandatory end-of-grade exams to determine their proficiency in subjects like English and math. The state sets a benchmark percentage performance on the end-of-grade exams that it considers proficient and assigns it a score of 3. Proficiency is labeled on a 1-5 scale.
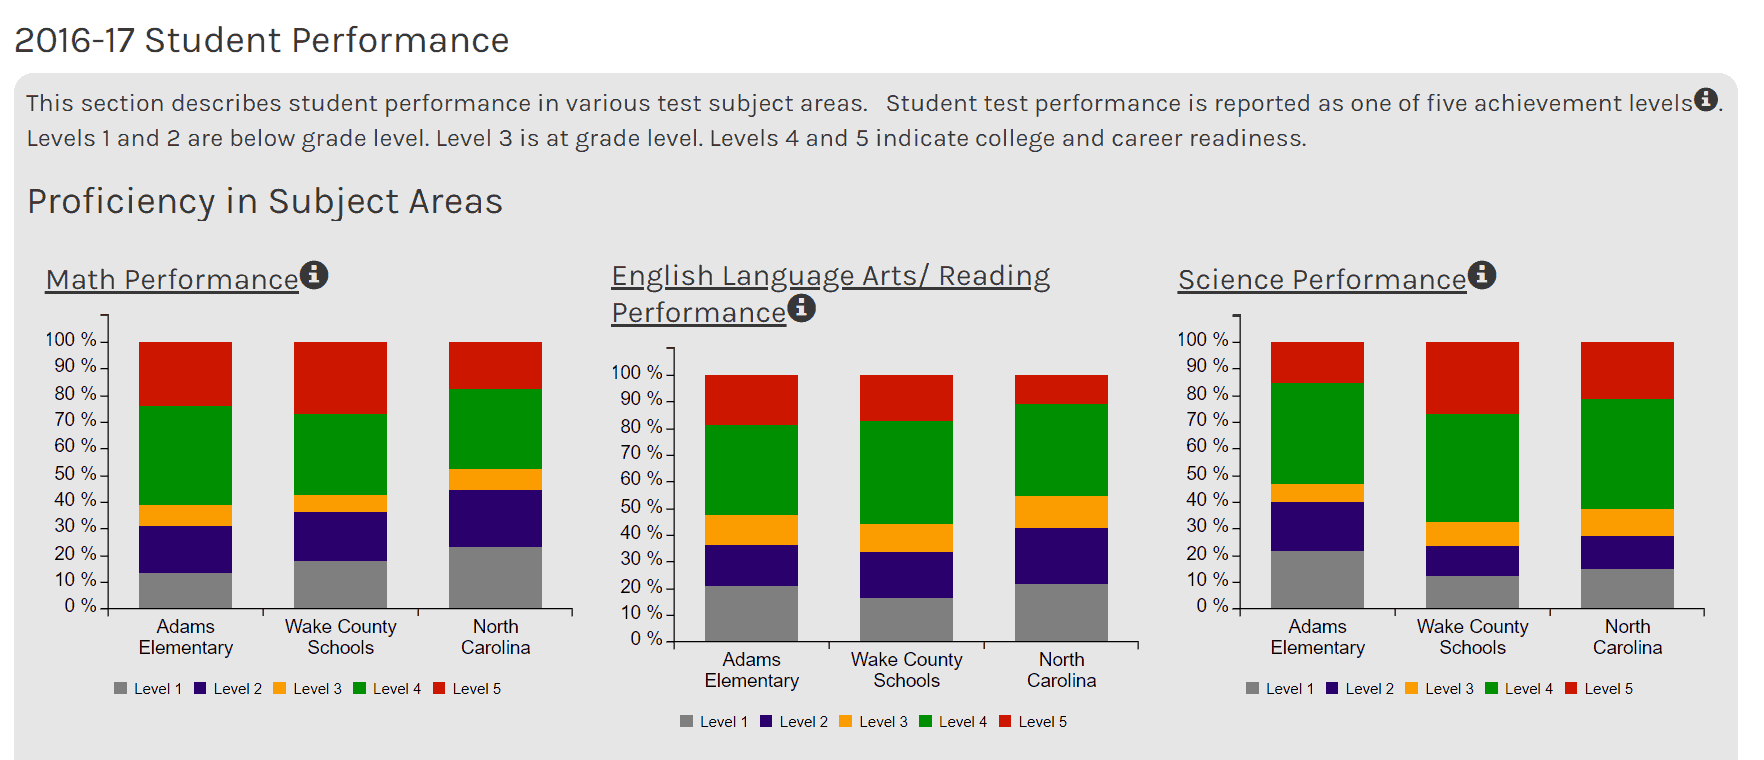
Academic growth in North Carolina is measured by a model called EVAAS, or the Education Value-Added Assessment System, a program developed by SAS. EVAAS is used in five states: Tennessee, Ohio, Pennsylvania, South Carolina, and North Carolina. Broadly, growth measures a student against him or herself when compared to average student growth across the state. The state places students in one of three growth categories: did not meet expected growth, met expected growth, or exceeded expected growth.
For more on EVAAS, see this EdExplainer.
https://www.ednc.org/2017/10/25/edexplainer-ins-outs-evaas/
School Business Systems Modernization
As detailed above, DPI collects an array of data and information on its students and educators. But beyond state and federal reporting requirements, what purpose does all of this data serve? This is where the process of harnessing data to make decisions comes into play. The School Business System Modernization (SBSM) initiative at DPI aims to allow the state, DPI, and LEAs to make better informed decisions faster, implement them quicker, and ultimately reduce the cost of data-driven decision-making.
SBSM, under the direction of Mike Spano, was created by the legislature (Session Law 2016-94 Section 8.15) and works to ensure “every school district has up-to-date financial, business, and technology systems to serve its students, parents, and educators.” One aspect of SBSM’s mission is providing timely and transparent data — including financial, human resources, licensure, and student information data. According to a March 2018 SBSM report:
“The School Business Systems Modernization (SBSM) program approach solidified around the concept of improving Data Driven Decision Making, or simply stated answering questions quickly using current, accurate and complete Data from all of the Public School System landscape. Currently, accurate and timely reporting and analysis of financial, employee, student, and related data is cumbersome and even thwarted by the independent silos of data.”
The General Assembly charged the State Board of Education in collaboration with the Friday Institute for Educational Innovation to develop the SBSM plan. Upon approval of the plan in 2017, NC DPI was charged with implementing the plan (Session Law 2017-57 Section 7.16) and the State Superintendent was directed to work with the Friday Institute, the Government Data Analytics Center (GDAC), local superintendents, charter school leadership, and others to carry out certain aspects of the plan. The General Assembly appropriated a total of up to $2.85 million for the 2017-19 fiscal years to establish positions and/or contract for services for business-specific project management of SBSM. DPI was also directed to transfer up to $3.5 million over 2017-19 to GDAC for the development and deployment of a data integration service.
Ultimately, SBSM will create a uniform data system housed at GDAC for storing data from all 115 LEAs across North Carolina, including student information, teacher preparation data, teacher recruitment data, teacher licensure data, and financial data. To ensure standard reporting of all of this information across the state, the SBSM project is expanding the specifications in the Uniform Education Reporting System (UERS).
The Uniform Education Reporting System was created by the State Board of Education and includes standards and procedures that closely define how and when financial data is recorded and processed. SBSM is expanding the UERS to more closely define financial, human resources, student information, and operational data. HR data includes information about applicants, teachers, principals, bus drivers, and all other personnel employed in public schools. These data range from how much they’re paid to when they were hired to what licenses and certifications they hold. Operational data includes things like the number of seats in every classroom.
By establishing a central information data store and a uniform standard for data reporting, SBSM will ensure that all of DPI’s data is in one place and in the correct format, eventually allowing for the seamless flow of data into a data dashboard that will display real-time metrics, such as teacher pay. According to Spano, this process will usher in a few benefits. For one, it will save staff capacity, because data requests from legislators and other stakeholders will be processed much more efficiently. This will allow DPI staff to spend more of their time focused on data-driven decision-making and less time on pulling together data reports to respond to policy questions.
Additionally, this process will allow for more proactive, data-informed decision-making on topics ranging from teacher recruitment to class size to educator preparation evaluation. For example, the system would allow decision-makers to hone in on the granular specifics of class size. If larger school districts could easily implement a 17-student cap on class size, while that same 17-student cap would create large financial burdens for smaller school districts to implement, the system could quickly identify those nuances. Then, those working on class size legislation would have rich analytics and data to review when considering what policy is most appropriate. According to Spano, access to specific, up-to-date analytics will allow the state, DPI, and LEAs to constantly improve.
Other organizations that use DPI’s data
The North Carolina Education Research Data Center (NC ERDC) at Duke’s Center for Child and Family Policy was created in 2000 through a partnership with DPI to store and manage data on the state’s public schools, students, and teachers. These data, which date back to the mid-1990s and are anonymized, can be accessed by researchers and government agencies for a fee of about $3,500. The breadth, depth, and accessibility of these data contribute to the fact that North Carolina education data are frequently used in research.
The Education Policy Initiative at Carolina (EPIC) is a policy research and evaluation initiative within UNC Public Policy. According to Kevin Bastian, associate director and research associate, EPIC has had access to student-level DPI data for about a decade. More recently, EPIC entered a five-year data agreement with DPI. EPIC uses this data along with data from institutions of higher education for a wide variety of research projects, including work on education preparation and effectiveness in partnership with the UNC System. Unlike NC ERDC, EPIC’s data set is internally-facing and is not made available to external researchers.
The SERVE Center at UNC Greensboro is a university-based research, development, dissemination, evaluation, and technical assistance center. According to Julie Edmunds, program director for secondary school reform, the SERVE Center creates data sets based on the studies they are conducting and partners with NC ERDC at Duke to host those data sets. For example, SERVE has a longitudinal data set that links a sample of early college students in North Carolina to data from DPI, the community college system, and the UNC System.
College-level information from the 58 colleges in the North Carolina Community College System is collected through a student information system called Colleague. This system collects a wide variety of data from course scheduling to financial aid. At the end of every semester, each college prepares a file with the data they are required to send to the System Office, and an extraction program is distributed that pulls that information from their local systems and pushes it up to the System Office.
The Data Management and Integration team at the System Office supports the System Data Warehouse. This data warehouse is used to create the statistical reports and state performance measures detailed below.
In 2016, the State Board of Community Colleges created a Data Governance Committee (DGC) that is charged with monitoring, modifying, and enforcing procedures and policies that “directly impact centralized data quality, collection, and reporting.” The committee is composed of 15 members from the colleges and the System Office, as well as professional associations such as the NC Adult Education Association, who serve three-year terms. Among other objectives, the DGC is charged with developing and overseeing a system-wide data dictionary that will provide standard definitions for all the types of data collected throughout the system to ensure the data are accurate and reliable.
The Research and Performance Management department of NC Community Colleges System Office, led by Bill Schneider, leverages data collected by the System Office to conduct research about the system and shares those results to inform planning, policymaking, and performance processes. Much of the data collected by the System Office are high-level metrics required for state and federal reporting, such as student demographics, course enrollment and completion, and graduation. While colleges are collecting this information about their students in real-time, the System Office does not. Rather, fall semester data are typically reported to the System Office in February, and spring semester data are typically reported in June.
Statistical reports
The System Office offers statistical reports, available online dating back to 2010, that include information on both total enrollment and full-time equivalent (FTE) enrollment for the entire system and all 58 colleges. A full-time equivalent student is defined as an amount of instruction that equates to 512 student hours. This measure, based on total student membership hours rather than the amount of students who are enrolled, is used to determine state funding.
Four statistical reports — detail FTE, summary FTE, curriculum student enrollment, and continuing education student enrollment — are offered online. These reports can be split by semester (fall, spring, summer) or viewed annually. The most recent available reports, linked below, are from the 2016-17 academic year.
- Detail FTE: Provides a breakdown of FTE by various areas within both curriculum programs and continuing education programs. On the curriculum side, this report breaks down FTE by associate degree, certificate, diploma, college transfer pathway, and transitional. On the continuing education side, this report breaks down FTE by basic skills training, small business center, community service, and more.
- Summary FTE: Provides total FTE counts for curriculum programs, basic skills, continuing education, and the entire college.
- Curriculum student enrollment: Provides a breakdown of student enrollment by transfer/general education and career/technical education. Transfer/general education includes students enrolled in arts and sciences, while career/technical education includes students enrolled in program areas such as engineering and construction. Also provides a total, non-duplicated count of curriculum student enrollment.
- Continuing education student enrollment: Provides a breakdown of student enrollment by various types of continuing education programs, such as basic skills, human resources development, and the small business center. Also provides a total, non-duplicated count of continuing education student enrollment.
State performance measures
Annually, the NC Community College System publishes the Performance Measures for Student Success report. This report is offered online as both a PDF and as an interactive dashboard hosted by SAS. Each report includes accountability data at both the system level and the individual college level for the previous year. The 2019 report, which will include these data for 2018, has not yet been published.
Seven state performance measures were adopted in 2016 by the General Assembly (SL 2016-94 Section 10.1): basic skills student progress, student success rate in college-level English courses, student success rate in college-level math courses, first year progression, curriculum student completion, licensure and certification passing rate, and college transfer performance. The General Assembly also requires annual publication of these performance ratings online and allows the State Board of Community Colleges to “allocate funds among colleges based on the evaluation of each institution’s performance.”
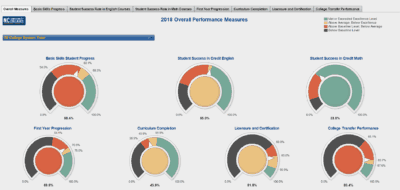
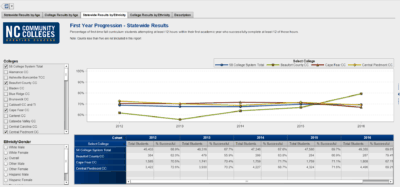
The colors used in the dashboards shown above indicate various levels of performance within each measure, ranging from met or exceeded the excellence level (green) to below the baseline level (gray). Based on three years of data for each of the seven measures, system-wide baseline levels are set two standard deviations below the system mean, and excellence levels are set one standard deviation above the system mean. Every three years, baseline levels are reset and the performance measures are reviewed to ensure the measures and methods for evaluating colleges are current.
All of the data available online are aggregated at the college level. However, you can disaggregate the data based on gender and ethnicity, allowing stakeholders insight into how different student groups are performing at each college and revealing achievement gaps between these groups.
Beyond state performance measures, the System Office also publishes an annual Measurable Skill Gains Report to meet federal reporting requirements. This report, published online as a PDF, covers measurable skill gains, employment indicators, and credential attainment indicators for adult education students.
The Data and Analytics department at the UNC System, led by Daniel Cohen-Vogel, “provides decision support to UNC leadership, the Board of Governors, the Legislature, and various other stakeholders” by analyzing data from a central database that contains information on all 17 UNC System institutions. These data are used for federal education reporting requirements, such as IPEDS (Integrated Postsecondary Education Data System), but also for planning, analysis, and assessment efforts both at the System Office and on individual campuses.
After multiple years of planning and design, the UNC System overhauled the way it collects and stores data with the system-wide launch of the Student Data Mart at the beginning of 2016. Previously, colleges in the UNC System would send flat files from their campuses to a server at the UNC System office. Now, the UNC System pulls secure streams of data directly from each campus up to the Student Data Mart where it runs through data validations and error checks.
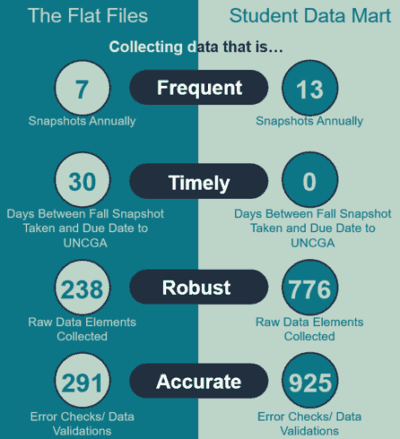
Multiple times a year, snapshots of each college’s data are collected on things like student demographics, financial aid, courses, instructors, and facilities. To ensure the uniform collection of these data across the system, the UNC System has a Data Dictionary with detailed information about each element in the Student Data Mart. The establishment of the Student Data Mart increased data transparency and allowed more time to be spent on data research and analysis rather than data collection and quality control.
The UNC System’s Data Dashboards provide a public-facing, interactive tool to analyze data on the system’s 17 campuses. The eight interactive data dashboards are:
- Enrollment: enrollment trends, enrollment demographics, where students come from, student majors
- Transfer students: transfer student enrollment, first-year performance, graduation rates
- Facilities usage: room usage analysis, seat usage analysis, facilities usage trends
- Freshmen admissions and performance: admissions scores and grades, first-year GPA, graduation, and persistence
- Research and development: historical and current data on research and development funding
- Degrees: degrees awarded and degree programs
- Jobs for NC: NC TOWER provides information on employment rates, wages, and continued higher education enrollment of graduates from the NC Community College System and from UNC System schools.
- Educator quality: teacher and school leader preparation, licensure, and performance data
In addition to these data dashboards, the UNC System also offers the following set of System Level Dashboards that track progress towards the System’s Strategic Planning goals. These dashboards are also populated using data from the Student Data Mart.
- Access: This dashboard tracks the System’s progress towards increasing things like low-income enrollment, completions by low-income students, rural enrollment, and completions by rural students.
- Student success: This dashboard tracks the System’s progress towards increasing the five-year graduation rate, increasing undergraduate degree efficiency, and closing achievement gaps.
- Affordability and efficiency: This dashboard will track the System’s progress towards affordable tuition and increasing its financial and operational flexibility.
- Economic impact and community engagement: This dashboard tracks the System’s progress towards increasing things like critical workforce credentials and research productivity.
- Excellent and diverse institutions: This dashboard will track “areas of distinction” for each of the UNC System institutions and metrics related to human capital.
Teacher and school leader preparation data
The P-12 Strategy & Policy Division of the UNC System, led by Julie Kowal, collects and analyzes teacher and school leader preparation data as part of the UNC Educator Quality Research Initiative and supports programs like the North Carolina Teaching Fellows Program and UNC Lab Schools.
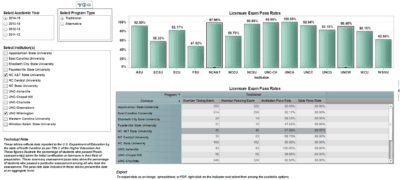
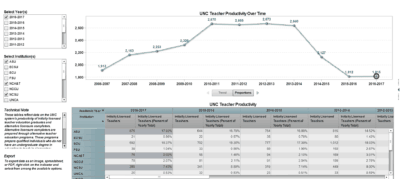
The UNC Educator Quality Dashboard was designed to “strengthen, focus, and enhance” UNC’s 15 educator preparation programs and provides data and information on teachers and school leaders from each of them. The dashboard, developed in partnership with SAS, was launched in 2015 by the UNC System Office to provide the public with an interactive way to consume and analyze data on the quantity and quality of educators across the state.
Indicators included in the dashboard were recommended by the UNC Board of Governors Subcommittee on Teacher and School Leader Quality. The performance outcomes and indicators in the dashboard are grouped into the following categories:
- Recruitment and selection: licensure exam results, academic profile comparisons, selection criteria
- Educator preparation: time to degree, enrollment trends, clinical experiences
- Performance and employment: retention rates, recent graduate surveys, EVAAS scores, teacher evaluation rating, etc.
- University-School partnerships: data on each University-School partnership in the system
The UNC System has partnered with the Education Policy Initiative at Carolina (EPIC) to connect the dots on educator outcomes for those who are trained within the UNC System and then enter a North Carolina public school. To do so, EPIC collects data from the UNC System on teachers and school leaders who graduate from UNC’s 15 educator preparation programs. Then, EPIC links those graduates to records of their employment with DPI, such as where they are employed and how their students perform.
In Senate Bill 599, the legislature passed a robust set of accountability indicators for all educator preparation programs in North Carolina. These performance indicators will exist in a statewide data dashboard hosted by the State Board of Education.

Why Statewide Longitudinal Data Systems?
Prior to the creation of a Statewide Longitudinal Data System (SLDS), student and staff data — including everything from third-grade test scores to high school graduation rates to postsecondary workforce salaries — remained isolated and siloed in multiple individual systems. With access to data on North Carolina’s K-12 students, one could answer questions like: What is the graduation rate for each high school? Yet, there was not a quick and seamless way to connect those high school graduates to their future achievements in postsecondary education and the workforce.
In addition, prior to the creation of a SLDS, K-12 data existed in multiple data collection systems within DPI, requiring student records to be manually matched across different systems to conduct analyses of trends and relationships over time. While student records could eventually be matched, this process required additional time and effort and produced some ambiguous matches.
A SLDS connects data from multiple different systems, improving the quality of data and rendering it more accessible. By tracking students between and across systems from early childhood education to the workforce, a SLDS allows robust policy questions to be answered, such as: What industries employ the most high school and college graduates? Are ACT scores correlated to workforce salaries? Which students from which schools need remediation classes in higher education? The system matches student records in a way that both saves time and improves accuracy compared to the prior system of manual matching.
An effective SLDS allows all sectors, districts, schools, educators, and other stakeholders to make data-driven decisions to improve student learning and outcomes. The U.S. Department of Education, which offers grant funding for the creation of Statewide Longitudinal Data Systems, says the following about their merits:
“With such comprehensive data systems, states will be able to monitor their reforms and make specific changes to advance them. These data systems will capture data on students from one grade to the next, measuring whether they are on track to graduate and telling K-12 schools whether they are preparing their students to succeed in college and the workforce. The data systems also can help identify teachers who are succeeding so states can reward them, and find teachers who are struggling and help them improve.”
Looking back: CFS and CEDARS
North Carolina’s first SLDS was established in 1992 with the creation of the Common Follow-up System (CFS). Currently maintained by the North Carolina Department of Commerce’s Labor and Economic Analysis Division (LEAD), its purpose is to provide information on the educational and employment outcomes of participants in publicly supported education, employment, and training programs. Thus, CFS functions as the SLDS for postsecondary education and workforce data.
Although the system began as a single-year matching system, it was eventually converted to a longitudinal database that allowed the tracking of a person’s progress through the workforce over time and allows comparisons at specific points of time. The North Carolina Tool for Online Workforce and Education Reporting (NC TOWER) is the online information delivery tool for the CFS. It allows the public to explore performance measures for all 16 UNC System campuses and all 58 North Carolina Community College System colleges.
In 2007, NC DPI was awarded a $6 million grant from the SLDS Grant Program for development of the North Carolina Common Education Data Analysis and Reporting System (NC CEDARS) to connect early learning and K-12 metrics. That grant, which ended in 2010, resulted in the reliable matching of staff-level and student-level records over time. The grant was supplemented with $6.1 million in state and other funds.
With the creation of NC CEDARS, students and staff from public Pre-K programs and the K-13 system were assigned a UID, or a unique identifier, as previously discussed. These identifiers stayed with those individuals regardless of the circumstance. If a student transferred to a private school and then re-enrolled, changed schools within a district, changed schools and changed districts, or any other number of potential disruptions, his records would remain linked and unified over time with the use of his UID. This allowed for the tracking of student and staff outcomes across the public school early learning and K-13 system.
P20W: NC SchoolWorks
What if all of North Carolina’s education systems — from early childhood education through the workforce — could seamlessly track students and staff across time and systems? What if there was a transparent and quick way for researchers to access early childhood, K-12, postsecondary education, and workforce data on a group of students from a specific school or grade?
In 2012, NC DPI was awarded a $3.6 million grant from the SLDS Grant Program for the development of a system that could do just that. Grant partners included NC DPI, University of North Carolina General Administration, NC Community College System, NC Independent Colleges and Universities, and the Labor and Economic Analysis Division of the NC Department of Commerce. That grant supported the creation of NC SchoolWorks, North Carolina’s SLDS connecting data from early learning through the workforce. The grant ended in June 2017, and the General Assembly funded two positions within DPI for continued support of the system.
Statewide longitudinal data systems like NC SchoolWorks rely on the UID system. Under NC SchoolWorks, the UNC System and NC Independent Colleges and Universities (NC ICUs) agreed to implement the K-12 UID system developed by DPI under CEDARS. The first time students enroll in public early childhood education or public K-12 education in North Carolina, they are assigned a UID by the LEA. If students transfer directly into an institution of higher education from out-of-state or from a private secondary school, they are assigned a UID at that point.
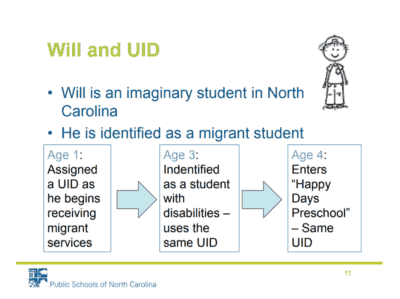
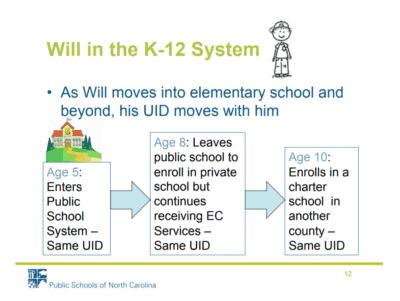
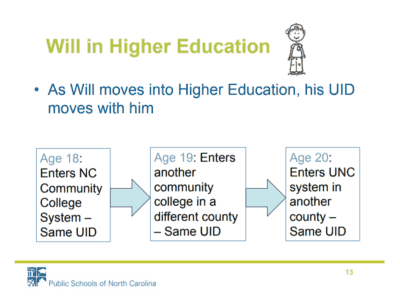
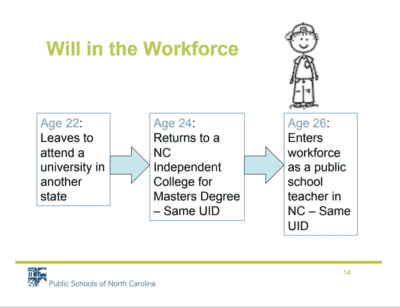
As with CEDARS, these UID’s remain connected to that unique student throughout his progression through the different systems, even if he leaves and re-enters at a later point. Despite the ability to link individual student and staff data over time, NC SchoolWorks is not designed to provide information on individuals. Rather, it’s designed to produce data on cohorts of students, schools, and programs over time. The use of the UID system ensures no names, social security numbers, or contact information is tracked. For example, a researcher can’t request data on Emily — but he or she could request data on the attainment and eventual earnings of all students from Emily’s elementary school in a given set of years.
According to Pond, all of the NC SchoolWorks partners have agreed to align their data to the standards established by the Common Education Data Standards (CEDS) to ensure the seamless pairing of information. The use of these common definitions and standards ensures that any field — for example, first name — is listed the same way across all of the agencies participating in NC SchoolWorks. If the community college system defined first name as “first_name” and the UNC System defined it as “name_first” — translations would be needed to put the data together.
It’s easiest to think of NC SchoolWorks as a hub-and-spoke model where each of the agencies with existing data systems operate as the spokes connected to a central data broker as the hub. This model allows stakeholders to submit data requests for specific cohorts of students or staff. For example, one might want to know the graduation rate for the class of 2018, as well as what percentage of those students entered community college and four-year degree programs.
That request is then processed by the data broker hub, which goes into each of the relevant databases — in this case, it would pull student information from DPI, the community college system, the UNC System, and the NC ICUs — and pulls down the records it needs to fill the request. This system is a “federated data system” that allows each agency to remain responsible for their own data rather than merging all their respective databases into one data warehouse.
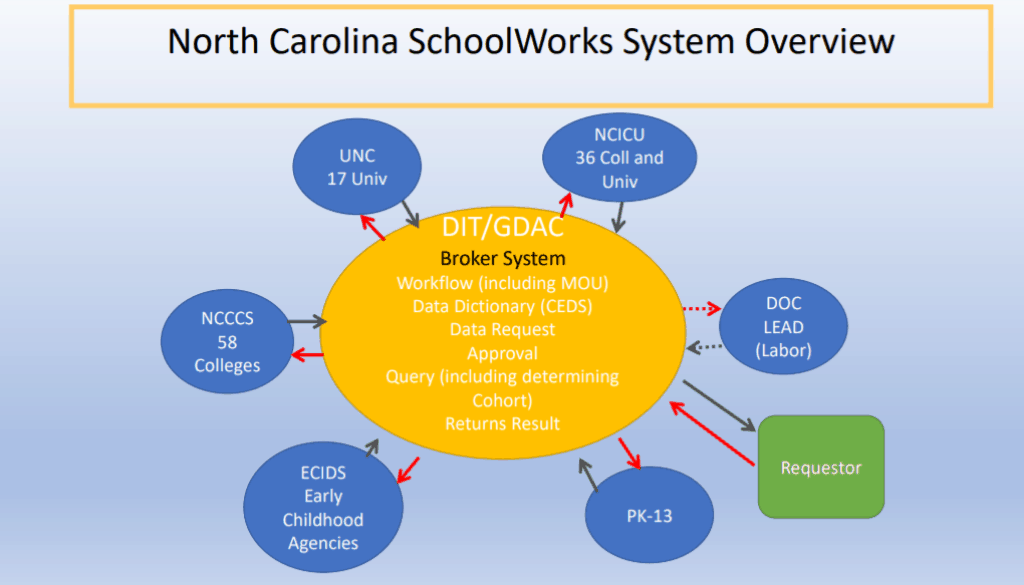
In the image above, each of the five NC SchoolWorks grant partners are represented by blue bubbles. The sixth blue bubble — ECIDS — represents the North Carolina Early Childhood Integrated Data System. NC ECIDS is a birth through 5 SLDS that combines information from NC Pre-K, child protective services, Head Start and Early Head Start, Preschool for Exceptional Children, Early Intervention, Subsidized Child Care Assistance Programs, and other programs to create a single integrated source for early childhood education, health, and social service data. It is funded by the state through a federal Race to the Top Early Learning Challenge grant and overseen by a Governance Council comprised of leadership from various state partnering agencies.
NC ECIDS only includes children ages birth to 5 in North Carolina who are receiving services from any of the participating programs. Aggregated standard reports are available to the public online, and researchers are able to make data requests directly to ECIDS. ECIDS uses the same UID system as the other NC SchoolWorks agencies to allow for the examination of the effects of early childhood programs over time.
According to Pond, NC SchoolWorks is operational but has not been opened to researchers and external stakeholders because additional refinements on some of the data still need to be made. Pond said the plan is for some standard reports from NC SchoolWorks to be made public, along with the ability for any member of the public to make data requests.
Numerous checks and balances are built into the NC SchoolWorks data request and delivery work flow. When a request comes into the system, the agencies involved in the request would be notified and have 14 days to review the request. If approved, the system sends a memorandum of understanding (MOU) and a confidentiality agreement to the requester. Once those forms are completed, the system will pull the requested data from each of the involved agencies. Then, after all agencies have reviewed and verified the data, it will be made available to the requester for 10 days. Once research is completed per the MOU, a data destruction document is sent to the requester. According to Pond, this work flow and the development of MOUs is why the NC SchoolWorks process has been lengthy.
K-12 terms
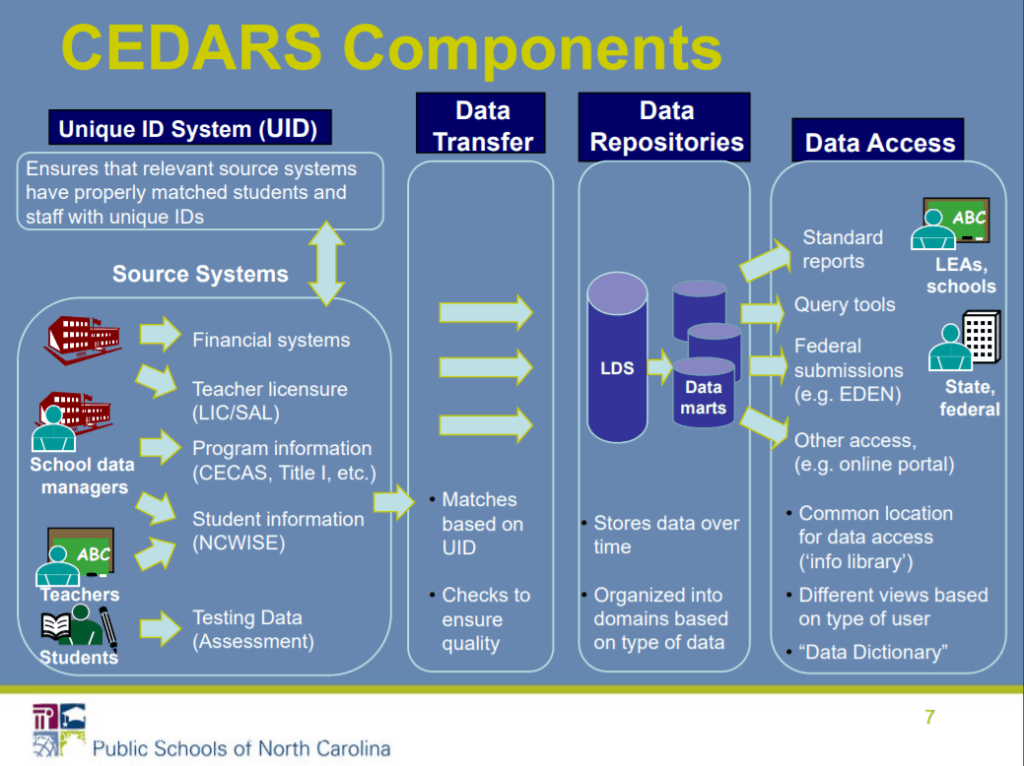
CEDARS: The Common Education Data Analysis and Reporting System is North Carolina’s PreK-13 SLDS. Funded in 2007 by a federal grant, CEDARS is composed of various DPI data collection systems, a student and staff identification system, a centralized data repository, and reporting/analysis tools.
CSPR: The Consolidated State Performance Report is submitted annually by DPI to the U.S. Department of Education to report on multiple No Child Left Behind programs. One purpose of this report is to encourage the integration of state, local, and ESEA (Elementary and Secondary Education Act) programs in planning and service delivery.
DMG: The Data Management Group is the data management oversight body of NC DPI. DMG is charged with the responsibility to set policy and resolve issues concerning agency data collection, management, and use. The purpose of the DMG is to enable the NC DPI to meet the responsibility of providing accurate and timely data to key stakeholders.
EVAAS: The Education Value-Added Assessment System is a program developed by SAS to measure the growth of students. It is used statewide in North Carolina, Tennessee, South Carolina, Ohio, and Pennsylvania. EVAAS combines two major data measures in education — achievement and growth — to calculate school performance grades. For more on EVAAS, read this EdExplainer.
EDDIE: The Educational Directory and Demographical Information Exchange is an online application with NC DPI school district and school information, including school numbers, administrative contacts, school types, grade levels, program types, addresses, and more.
NC School Report Card: An online resource that includes school- and district-level data on student performance and academic growth, school and student characteristics, and other details. School report cards are provided for all public schools, including charter and alternative schools. They are offered online on this interactive platform and in this more detailed platform, both hosted by SAS.
SBSM: The School Business Systems Modernization initiative works to modernize DPI’s systems for student information management, financial and payroll information, human resources information, and capital and repairs and renovations planning information. SBSM was created in 2016, funded in 2017 through the General Assembly, and is currently led by Program Director Mike Spano.
SEED: The State Exchange of Education Data project will enable participating states to track, monitor, and share information for transfer students who cross state lines. North Carolina is one of eight states currently participating in the project.
TOPS: Technical Outreach for Public Schools is a contract with DPI held by the Center for Urban Affairs and Community Services at NC State University to deliver various tests to assess student and school performance and to analyze and report results to accountability services.
UERS: Required by the NC General Assembly (G.S. 115C-12 (18)), the Uniform Education Reporting System was created by the State Board of Education and includes standards and procedures for collecting fiscal and personnel information. Edits to the UERS have to be approved by the State Superintendent and the State Board of Education. Currently, the UERS closely defines how and when financial data is recorded and processed to ensure oversight of allotments and expenditures of NC public schools.
Cross-system terms
CFS: The Common Follow-up System is North Carolina’s postsecondary and workforce SLDS. Maintained by the North Carolina Department of Commerce’s Labor and Economic Analysis Division, its purpose is to provide information on the educational and employment outcomes of participants in publicly-supported education, employment, and training programs for use in research and decision-making. CFS was developed in 1992 and has since been expanded and enhanced.
GDAC: The Government Data Analytics Center is housed within the North Carolina Department of Information Technology. GDAC assists other state agencies with business intelligence and master data management efforts, such as the School Business Systems Modernization, NC SchoolWorks, the Common Follow-up System, and the NC Early Childhood Integrated Data System.
P-20W: A P-20W data system is a type of SLDS that links data from early learning, K-12, higher education, and workforce. P stands for preschool, 20 stands for grade 20 or higher education, and W stands for workforce.
NC ECIDS: The NC Early Childhood Integrated Data System is an early childhood SLDS that serves as the single source of integrated data for select education, health, and social service programs from participating state agencies. NC ECIDS is overseen by a council comprised of leadership from the NC Department of Health and Human Services, NC DPI, the North Carolina State Head Start Collaboration Office, and the North Carolina Partnership for Children. Data in the system are available through this interactive portal that provides aggregate statewide reports that can be customized by county, demographics, and fiscal year. It also has a private data request portal for research data requests.
NC TOWER: As the information delivery tool of the Common Follow-up System, North Carolina’s Tool for Online Workforce and Education Reporting provides information on employment rates, wages, and continued higher education enrollment of graduates from the NC Community College System and from UNC System schools.
NCSW: The NC SchoolWorks information system is North Carolina’s P-20W SLDS. Funded in 2012 by a federal grant to DPI, NC SchoolWorks connects data on students from early learning through the workforce.
SLDS: Statewide Longitudinal Data Systems is a program run by the U.S. Department of Education that provides grants to design, develop, and implement statewide longitudinal systems that capture, analyze, and use student data from preschool to high school, college, and the workforce.
UID: The Unique Statewide Identifier System assigns a unique identifier to every student and staff member who participates in North Carolina’s education system at any point in time. These identifiers were first established by NC DPI under CEDARS and are now being used across the following agencies as part of the P20W SLDS: NC Early Childhood system, NC Community Colleges, UNC System, and NC Independent Colleges and Universities (ICUs).
Once a student or staff member is assigned a UID at their first entry into any of these systems, that student or staff retains the same UID as they transition between different parts of the education and workforce continuum. Within a SLDS, UIDs are used to track student and staff metrics and outcomes over time, even if they leave the system entirely and re-enter at a later point.
Other terms
CEDS: Common Education Data Standards is a specified set of the most commonly used education data elements to support the effective exchange of data within and across states, as students transition between educational sectors and levels, and for federal reporting. The standards are being developed by NCES.
EPIC: Education Policy Initiative at Carolina is a policy research and evaluation initiative within UNC Public Policy. EPIC conducts research and evaluation activities about education policy and practice, including an analysis of educator preparation and effectiveness in partnership with the UNC System.
IPEDS: The Integrated Postsecondary Education Data System is a system of interrelated surveys conducted annually by the U.S. Department of Education’s National Center for Education Statistics. IPEDS gathers information from every college, university, and technical and vocational institution that participates in the federal student financial aid programs.
NC ERDC: The North Carolina Education Research Data Center, housed at Duke’s Center for Child and Family Policy, was established in 2000 through a partnership with DPI to store and manage data on the state’s public schools, students, and teachers. The data, which date back to the mid-1990s, are available to external researchers and stakeholders for a fee.
NCES: The National Center for Education Statistics is the primary federal entity for collecting and analyzing data related to education in the U.S. and other nations. NCES is located within the U.S. Department of Education and the Institute of Education Sciences.
SERVE: The SERVE Center at the University of North Carolina at Greensboro is a university-based research, development, dissemination, evaluation, and technical assistance center. For nearly 30 years, the Center has worked with educators and policymakers to improve education.
State Performance Measures: Adopted by the General Assembly and reviewed every three years, State Performance Measures are the accountability metrics used by the NC Community College System to assess the performance of the system’s 58 colleges. The Performance Measures for Student Success Report is published annually online as a PDF and hosted in an interactive portal by SAS. These measures include first year progression and college transfer performance, among other things.

Recommended reading