Skip to content
EdNC. Essential education news. Important stories. Your voice.

Search ednc.org

Consider it mapped and the 2014-15 school grades

Share this story

Our republishing policy

EdNC is a nonprofit, online, daily, independent newspaper. All of EdNC’s content is open source and free to republish. Please use the following guidelines when republishing our content.
  • Our content must be republished in full. If your organization uses a paywall, the content must be provided in full for free.
  • Credit our team by including both the author name and EdNC.org in the byline. Example: Alex Granados, EdNC.org.
  • If republishing the story online, please provide a link to EdNC.org or a link to the original article in either the byline or credit line.
  • The original headline of the article must be used. Allowable edits to the content of the piece include changes to meet your publication’s style guide and references to dates (i.e. this week changed to last week). Other edits must be approved by emailing Hannah Vinueza McClellan at [email protected].
  • Photos and other multimedia elements (audio, video, etc.) may not be republished without prior permission. Please email Hannah Vinueza McClellan at [email protected] if you are interested in sharing a multimedia element.
  • If you republish a story, please let us know by emailing Hannah Vinueza McClellan at [email protected].

Please email Hannah Vinueza McClellan at [email protected] if you have any questions. This work is licensed under a Creative Commons Attribution-NoDerivatives 4.0 International License.

Canonical tag

Please include the following canonical tag in the <head> of the republished story.

<link rel="canonical" href="https://www.ednc.org/consider-it-mapped-and-the-2014-15-school-grades/">

HTML content

This includes the title, byline, content, and tracking pixel required for republishing this story.

This story is tagged:

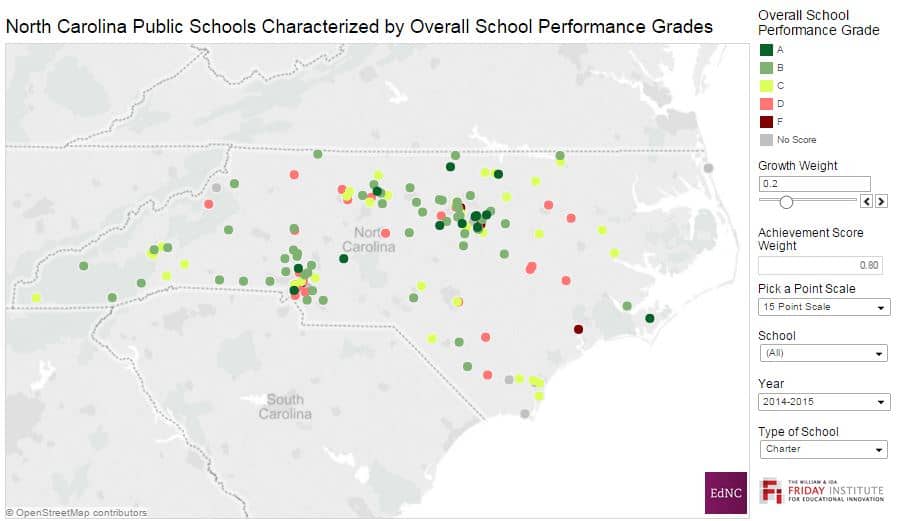
Yesterday Emily Antosyk of the Friday Institute for Educational Innovation released her latest map allowing comparison of the 2013-14 and 2014-15 school grades. For the first time, her map includes the grades for charter schools.

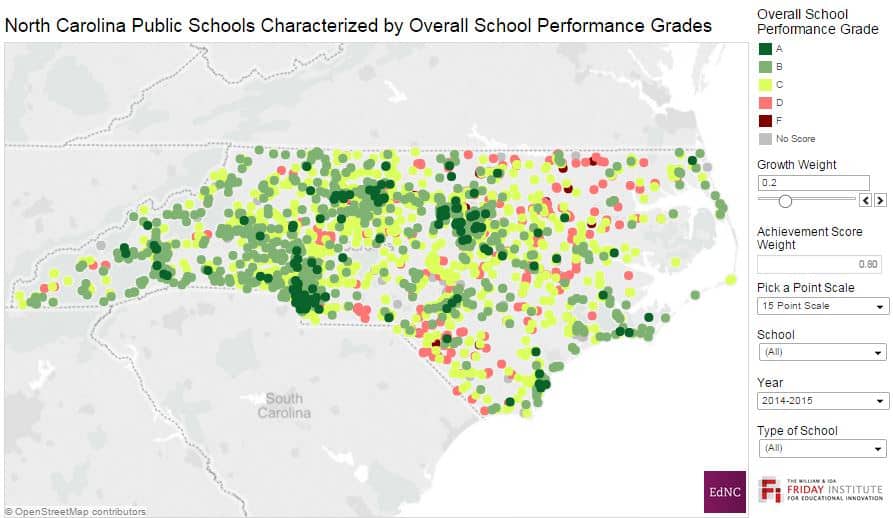
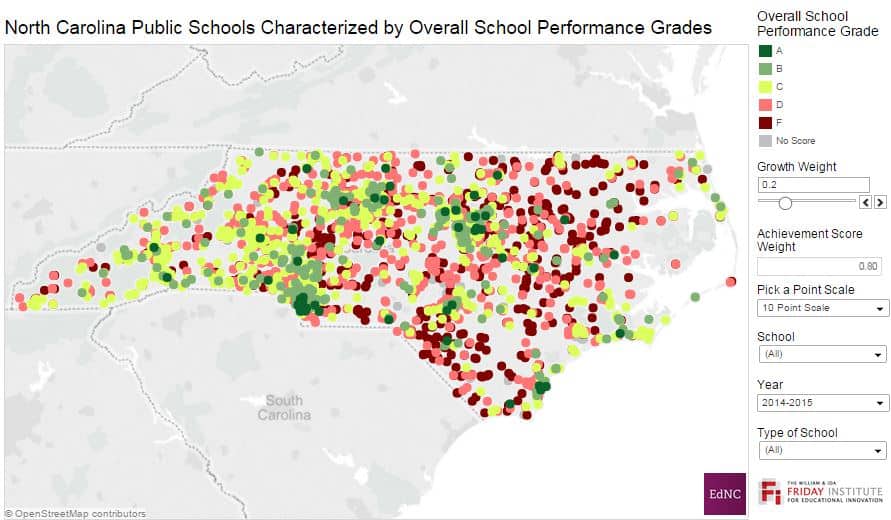
As a reminder, school grades in North Carolina were released for the first time last year, and the grades reflect 80 percent achievement and 20 percent growth. Antosyk’s map allows you to see how the school grades change if the state were using a 10-point grading scale instead of the 15-point scale currently in place.

This is the map with 80 percent achievement/20 percent growth and the 15-point scale.
802015

This is the same map with the 10-point scale.
802010

Antosyk’s map also allows YOU to choose the percentages based on your values to see how the grades change — statewide and for particular schools.

You could choose to have grades based on 100 percent achievement, 100 percent growth, flip it so that it is 20 percent achievement and 80 percent growth, or try out 50/50.

This is the map with 100 percent achievement.
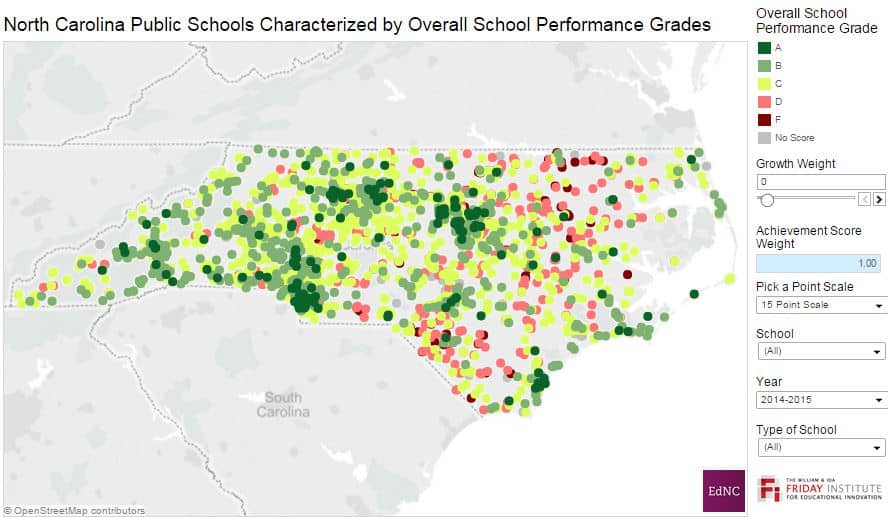
100ach

This is the map with 100 percent growth.
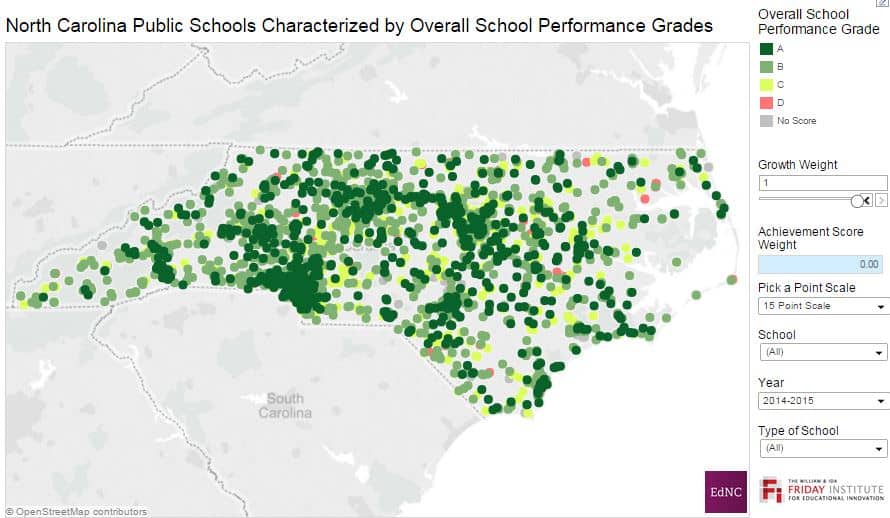
100growth

This is the map with 20 percent achievement and 80 percent growth.
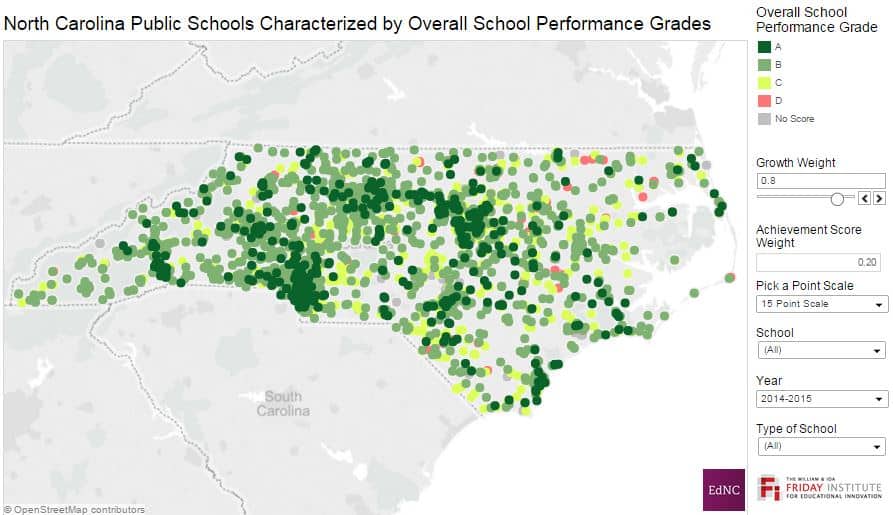
208015


This is the map with 50 percent achievement and 50 percent growth.
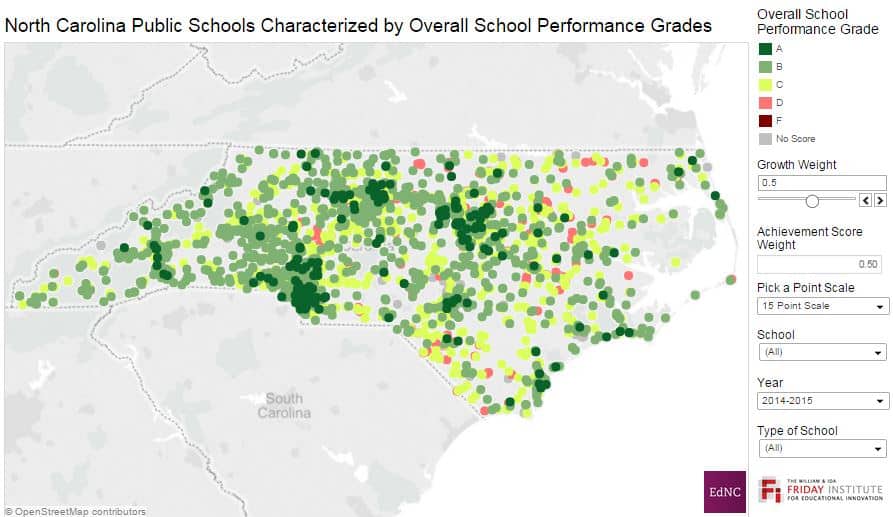
5050

Here is the charter school map.

Charter

Here is the charter school map on a 10-point scale.
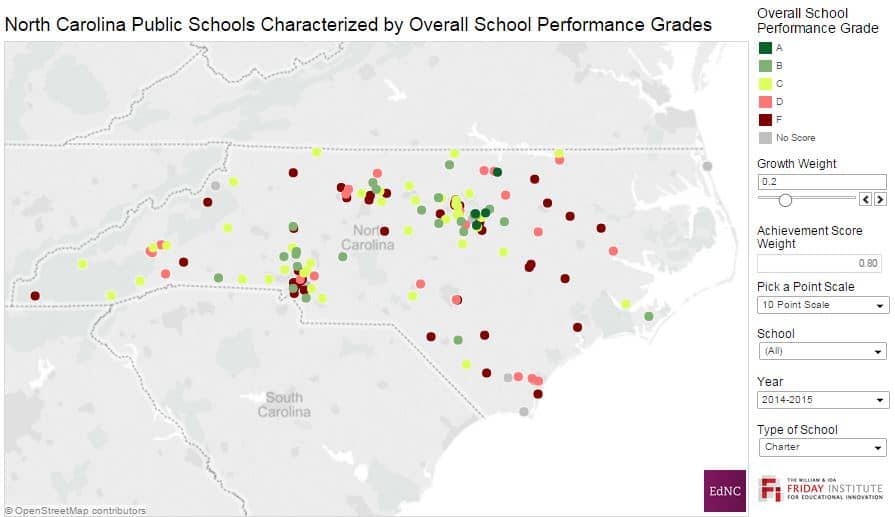
charter10

EdNC had this tool created to empower you — all of you — to take a deeper look at how these public policy choices — to have school grades, to use the existing 80/20 split, and the 15-point scale — impact your perception of our schools.

Share the maps you create by tweeting @EducationNC or leave them on our Facebook page.