Carolina Demography and the North Carolina Department of Public Instruction (DPI) have partnered to create a School District Typology, an instrument to review evidence-based grouping of school districts, according to a Sept. 25 press release produced by Emma Marshall, Carolina Demography’s research analyst and the typology’s project lead.
The UNC-Chapel Hill-based demographic research unit developed the tool to help DPI compare school districts for research and evaluation purposes, the release says, as well as efforts to scale interventions.
“It is hard to compare districts because there are many differences in local areas across the state’s 115 school districts,” the release says. “The 2025 North Carolina School District typology is intended to be a useful tool to help educational leaders, researchers, and other stakeholders make more appropriate comparisons across the state’s 115 school districts.”
![]() Sign up for the EdDaily to start each weekday with the top education news.
Sign up for the EdDaily to start each weekday with the top education news.
After working on the typology throughout the fall and winter of last year, Carolina Demography presented the tool to the State Board of Education during its April 29 meeting in Haywood County.
“Making appropriate comparisons, as you all know, between school districts in North Carolina is really challenging, considering the substantial variation and the local contexts across the state’s 115 local education agencies,” said Nathan Dollar, director of Carolina Demography, explaining the motivation for the typology’s development at the Board meeting.
Dollar said that researchers and practitioners have usually grouped districts by county population density. But this comparison method does not work for the 11 counties that have more than one school district, the press release said, and it fails to account for other differences between districts with similar population densities.
“Often, what we do in the state is we cluster our schools by region, and districts themselves will attempt to compare themselves to other districts, and I actually talked to a couple of superintendents about this — it’s almost like an eyeballing of it, right?” said Michael Maher, DPI’s chief accountability officer, at the Board meeting. “And so what we did was we contracted with Dr. Dollar to actually create an evidence-based way to cluster districts.”
The tool addresses that issue by combining 10 demographic and socioeconomic indicators to develop its clusters. Doing so allows districts within clusters to be as similar as possible.
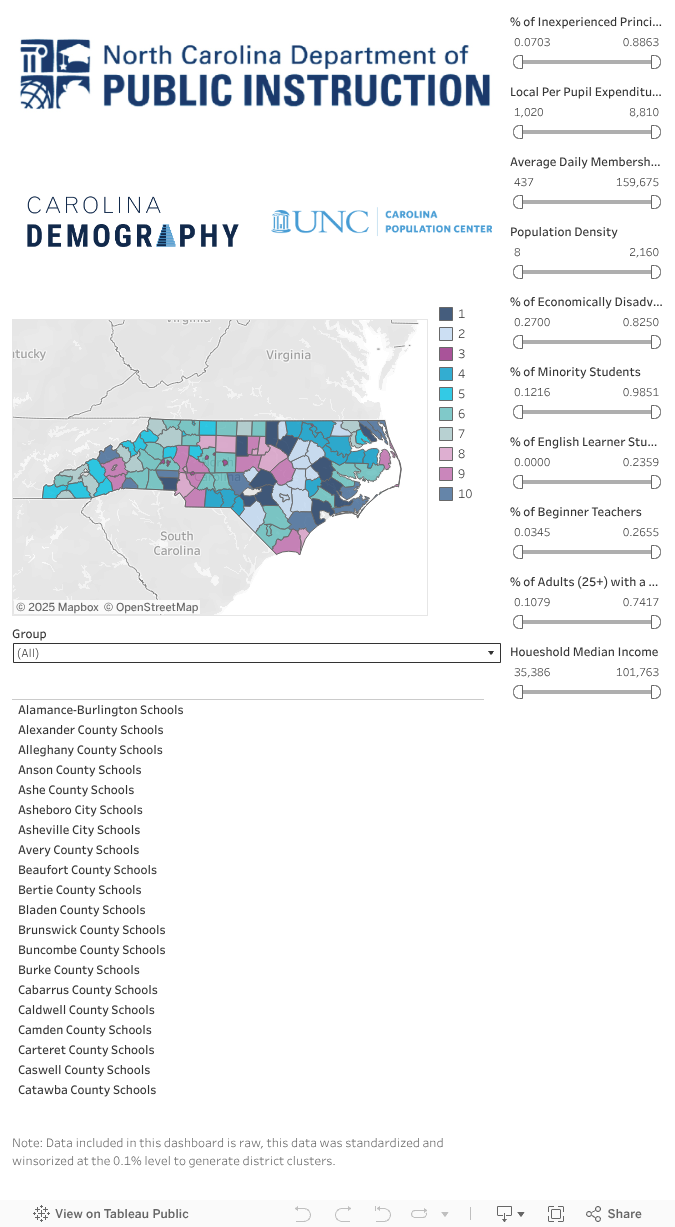
The factors considered include:
- Median household income (2023 5-year ACS)
- Percent of 25+ population with a Bachelor’s degree or higher (2023 5-year ACS)
- Population density (2023 5-year ACS)
- Percent economically disadvantaged students (EDS), (NC DPI EDS Reports, April 2024)
- Percent minority (Non-white students), (NC DPI Statistical Profile, 2024)
- Percent inexperienced principals (NC DPI School Report Card, 2023)
- Percent beginner teachers (NC DPI School Report Card, 2023)
- Percent English learner (EL) students (NC DPI EL Headcount November 2023 (numerator), NC DPI Statistical Profile, 2024 (denominator))
- Local per pupil expenditure (PPE), (NC DPI Statistical Profile, 2024)
- Total ADM (Average Daily Membership) Month Final, (NC DPI Statistical Profile, 2024)
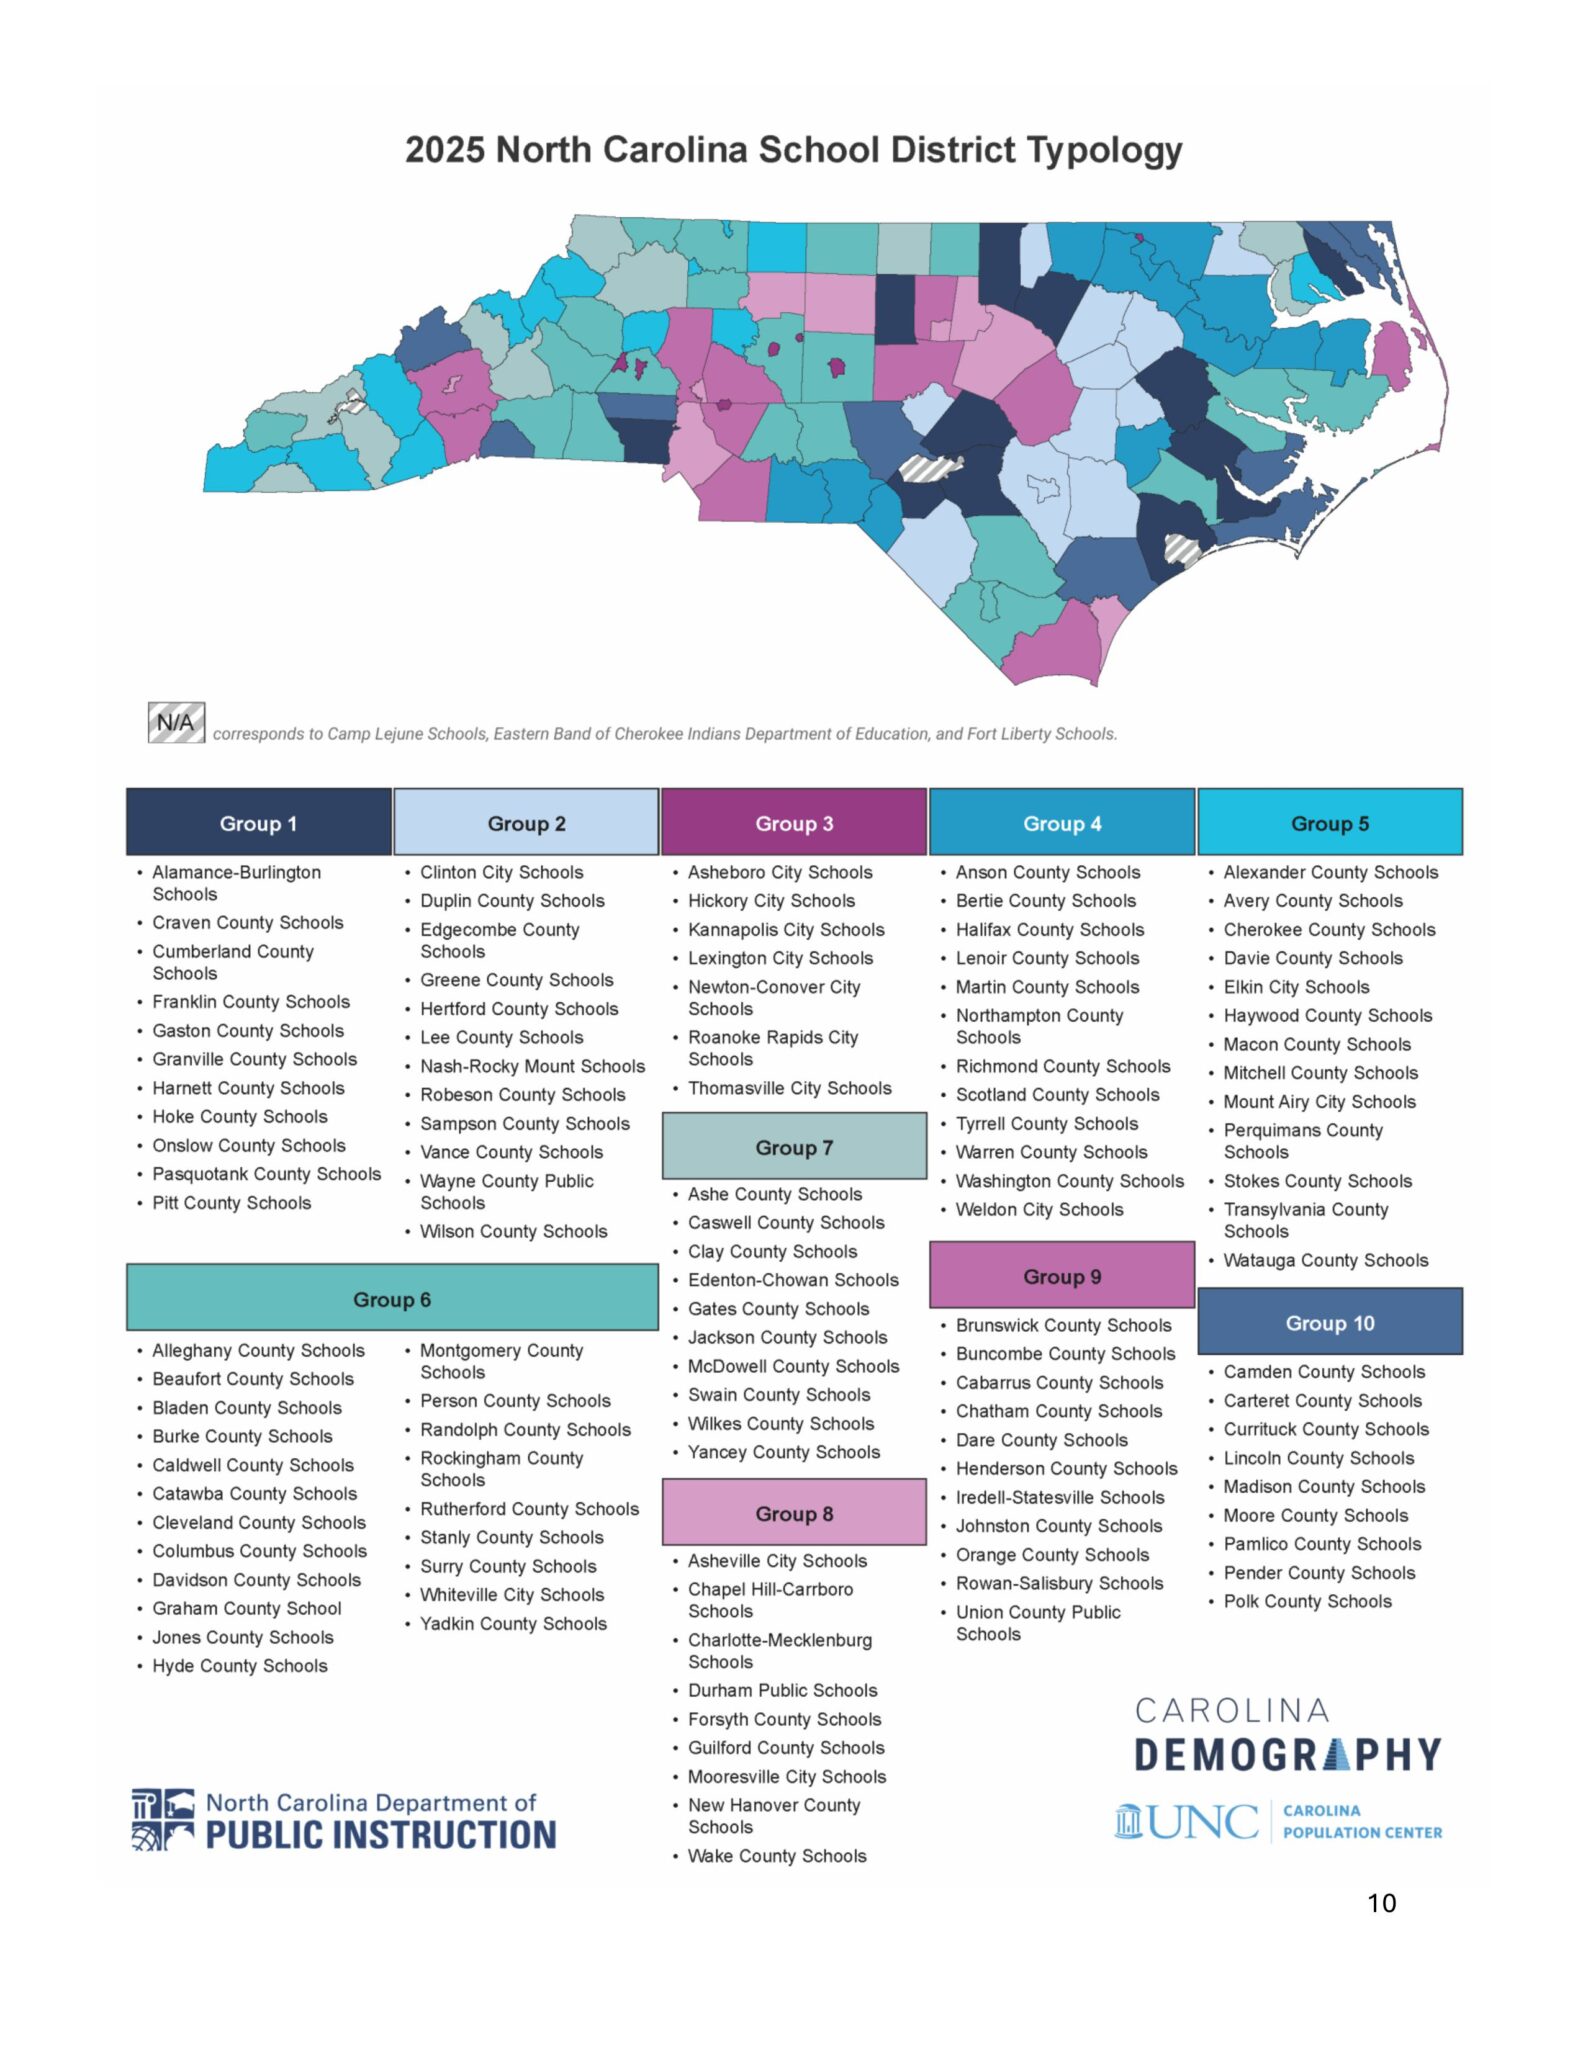
“This typology does not claim to put districts into perfect categories by socioeconomic, demographic, or institutional conditions,” the press release said. “Nevertheless, it places districts into ten groups where districts in the same group are more alike overall than those in different groups.”
The research group intends to work with DPI to create a school-level typology coming in 2026, the release said.

Recommended reading