As school boards in North Carolina faced tough questions last fall about whether, or how much, to reopen their doors to in-person instruction, what factors may have influenced their decisions? Judging from new research from Public Impact and EdNC, statewide COVID-19 rates appeared to matter more than local COVID-19 rates and other district characteristics.
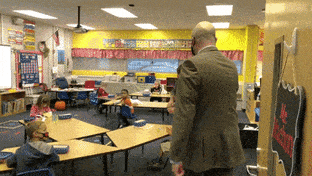
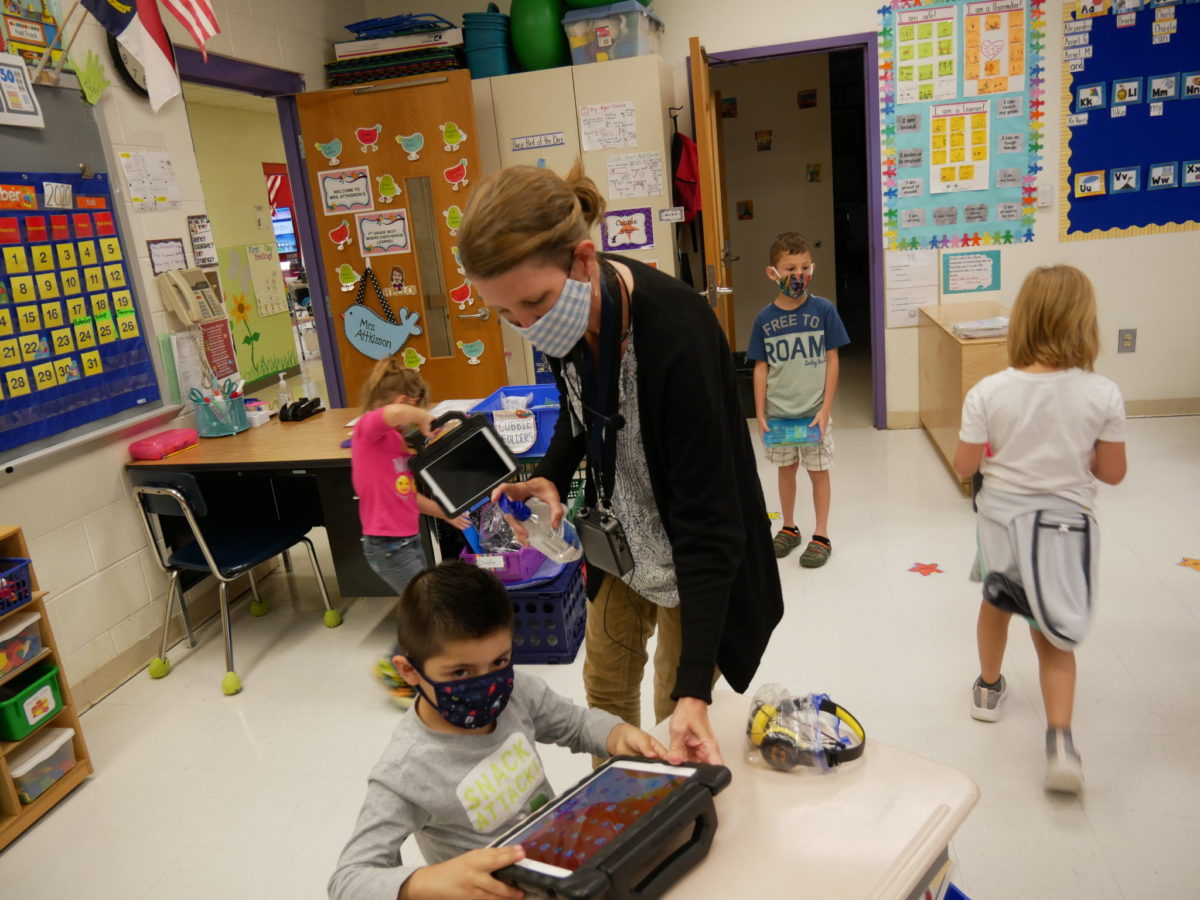
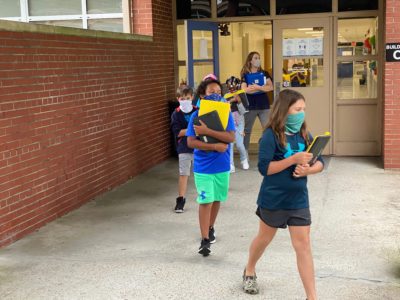
At the beginning of the fall semester, about half of North Carolina’s districts reopened with remote-only instruction. But by the end of 2020, 90% offered in-person instruction to at least some students.
As districts made changes to their plans for offering in-person, hybrid, or remote instruction, district leaders commonly cited trends in local COVID-19 rates. Descriptive data from the database that Public Impact and EdNC published in October suggested that district- and county-level demographics may also have played a role. For example, districts with higher concentrations of students of color were three times more likely to opt for fully remote learning (the state-designated “plan C”) to start the school year than districts with the highest concentrations of white students (76% versus 24%).
Related Readings

To further probe what influenced district decision-making, Public Impact and EdNC worked together again to create the new NC Instructional Shifts database, which tracks all instructional shifts that North Carolina school boards initiated throughout the fall 2020 semester.
Early results from descriptive data and regression analyses suggest that, in general, districts further reopened school buildings to in-person instruction throughout the fall semester, corresponding with state and national changes in COVID-19 rates. But we found no statistical evidence to support a relationship between district decision-making on further reopening schools and the local COVID-19 rate. In fact, we could not identify any district- or county-level characteristic that had a strong relationship to decisions — including the county’s political leanings.
About the database
To populate the NC Instructional Shifts database, Public Impact researchers used the North Carolina School Board Association’s (NCSBA) Reopening Database, which tracks instructional plan shifts over time in the state’s 115 school districts. Researchers scanned each district’s website and Facebook page to verify all of these shifts, locating school board meeting minutes whenever possible.
For each initiated shift in instructional plan in the fall — that is, each plan to shift, whether implemented or not — Public Impact captured the date of the school board’s decision, the expected date of implementation, and the plan that was to be implemented on that date. If the decision meant that students would be receiving less in-person instruction than what the district and board originally said, researchers coded this as “less in-person,” and vice versa for decisions that would result in “more in-person” instruction. A board decision to delay implementing previously planned in-person instruction was also coded as “less in-person,” since a delay, even if temporary, would lead to overall less in-person instruction for students during the semester.
For more details on how researchers coded each shift, please see the codebook in the “Variables” tab here.
![]() Sign up for the EdDaily to start each weekday with the top education news.
Sign up for the EdDaily to start each weekday with the top education news.
Early takeaways
Districts generally expanded the amount of in-person instruction in the fall.
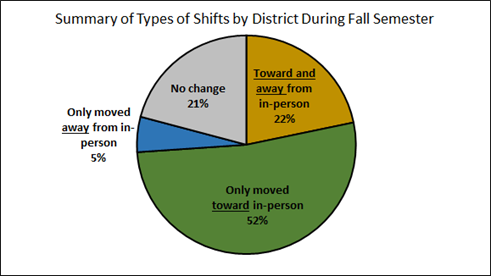
From the start of the semester through Dec. 31, 2020, we identified 140 initiated shifts in district plans. Seventy-four percent of districts made at least one shift expanding the amount of in-person instruction. Of these, 52% initiated instructional shifts that only moved their students closer to full-time in-person instruction, while the other 22% planned shifts to and from in-person. Approximately one-fifth of districts (21%) never initiated a shift in their plan for the fall semester.
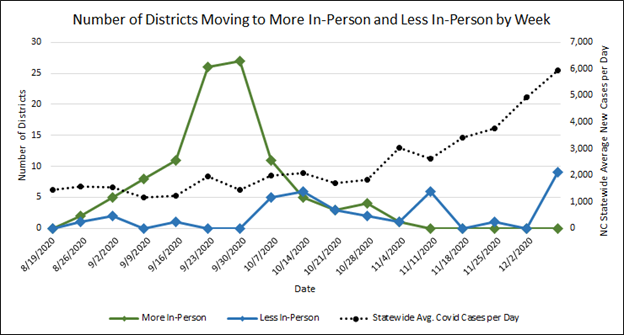
Trends in shifting toward more in-person instruction corresponded with state changes in COVID-19 rates.
Shifts away from in-person instruction remained steady over the fall semester, but shifts toward in-person instruction occurred mostly during the final two weeks of September, following Gov. Roy Cooper’s mid-September announcement that districts may choose to implement full-time in-person instruction (the state-designated “plan A”) for elementary grades.
These two weeks followed a month of falling state and national COVID-19 rates. After this period, as state COVID-19 rates rose through December, moves toward in-person became less and less likely, while moves toward remote instruction became more common before and after Thanksgiving and winter breaks.
Local factors, including COVID-19 rate and politics, had no statistical relationship to district decisions throughout the fall.
In regression analyses that included district- and county-level variables (see table below), researchers did not find evidence that local COVID-19 rates or local politics affected decisions on reopening schools throughout the semester. Across multiple models, we found that no indicators were strongly correlated enough with district decision-making to have statistical significance.
| Variable Type | Variable Name | Description |
| Tested Outcome | Change initiated | Indicates whether the district initiated a change in instructional plan during Week X, via an official board vote [Yes/No] |
| Tested Outcome | Direction of shift | Indicates whether there was a change initiated in Week X + the direction of the initiated shift in instructional plan [More In-Person / Less In-Person / No Change] |
| Tested Treatment | Change in local COVID-19 rate | 14-day moving average, calculated from week of decision, using data from NC DHHS Covid-19 Dashboard |
| Tested Moderator / Control Variable | County politics | Quartile based on 2020 election results |
| Tested Moderator / Control Variable | District enrollment | Quartile based on National Center for Education Statistics (NCES) 2019 data |
| Tested Moderator / Control Variable | District % of students qualifying for free or reduced-priced lunch | Quartile based on NCES 2019 data |
| Tested Moderator / Control Variable | District % students who are people of color | Quartile based on NCES 2019 data |
| Tested Moderator / Control Variable | County wealth | Quartile based on NC Low Wealth Supplement |
| Tested Moderator / Control Variable | County computer access | Quartile based on U.S. Census 2018 data |
| Tested Moderator / Control Variable | County internet access | Quartile based on U.S. Census 2018 data |
Results from these early analyses leave open many questions. Public Impact and EdNC invite other researchers to use the NC Instructional Shifts database to further investigate the question on district decision-making as well as others the data may support.
Questions on methodology? Please contact Molly Osborne at mosborne@ednc.org.


Recommended reading