What would you think if state legislators created a new A-F school grading system based on poverty, giving A’s and B’s to the schools that serve the fewest poor students while tagging the highest-poverty schools with D’s and F’s?
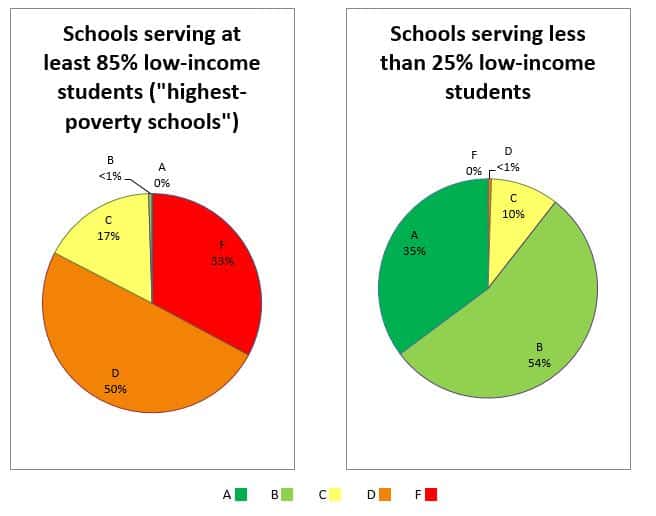
Unfortunately, the current grading scheme produces the same result. In its first year, out of 325 district and public charter schools statewide serving at least 85 percent low-income students—our state’s highest-poverty schools—none received an A, and only two received B’s (hat tip to Rock Rest Elementary School in Union County and Henderson Collegiate charter school in Vance County).
At the other end of the spectrum, out of 222 schools statewide serving less than 25 percent low-income students, none received an F and only one received a D. Nearly 90 percent of those schools received A’s or B’s, including more than 95 percent of district schools.
A-F: What’s The Formula?

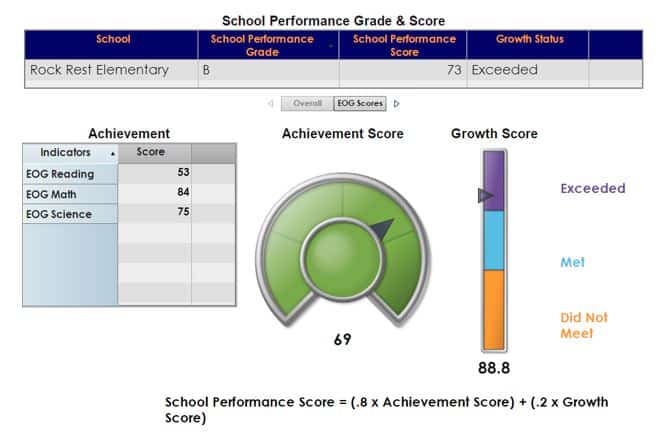
To understand why the grades shake out this way, one needs to first understand the formula. In North Carolina, school grades are based on two factors:
- School Achievement Score (80 percent of overall grade) – the percentages of students proficient on end-of-grade and end-of-course tests, graduation rate, and college and workplace readiness measures.
- School Growth Score (20 percent of overall grade) – improvement on the school achievement score factors from one year to the next, using EVAAS, a tool that measures the impact schools and teachers have on students’ academic progress.
These two factors are combined to create a single “School Performance Score” of 0-100, which results in a grade for each school according to the following scale: A = 85, B = 70, C = 55, D = 40, F = less than 40.
At the start of this year, North Carolina was one of 15 states nationally and one of eight states in the Southeast to have adopted an A-F grading system. Many other states, including those with the longest-standing and best-regarded A-F systems, including Florida, place a greater emphasis than we do on growth while de-emphasizing achievement. The reason for this is simple:
School achievement scores reflect single point-in-time test results, over which schools have far less control than growth, which is designed to measure the impact schools and teachers have on students’ academic progress.
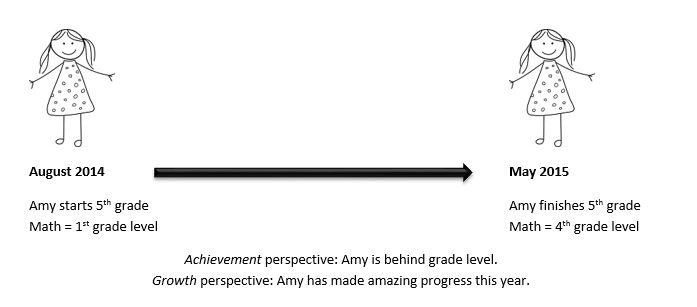
As an example, if a student enters fifth grade on a first-grade level in math, and her teacher helps her achieve three years of growth over the course of the year—an astounding rate—she will still be at a fourth-grade level, behind her actual grade. A system that prioritizes end-of-grade test results will deem that student a failure, along with her teacher and her school. A system that prioritizes “growth,” by contrast, will recognize the strong efforts of all involved to help the student achieve remarkable progress over the course of the school year.
Acknowledging the Link between School Performance Grades and Poverty
An article by Representative Graig Meyer published by EdNC on March 18 (“Common ground on school grades: We need to grade our schools, but we need to grade them differently”), cited an analysis of North Carolina’s school grades by Duke University’s Will Wilson that revealed a 61 percent correlation between a school’s free and reduced-price lunch population and its achievement score. By contrast, Wilson found only a two percent correlation between that same measure and a school’s growth score. Our analysis, which took into account the percentage of students categorized as low-income rather than free and reduced-lunch data, showed similar correlations.
Representative Meyer’s review and ours lead to the same conclusion: that the current system, with its heavy emphasis on achievement over growth, “pits our richest and poorest schools against one another for the sake of comparison.” The schools that earn D’s and F’s in our system, including the vast majority of high-poverty schools, earn those grades because the formula emphasizes factors students bring with them to school rather than what schools do once students enter the classroom. If you believe that all students regardless of their circumstances can achieve at high levels when schools provide strong and consistent supports, then our current formula is misguided at best and insulting at worst.
So what can be done to fix our A-F grading system?
Making A-F Grades Meaningful: Three Recommendations
Recognizing the problem—that we have an A-F grading system that repackages demographics in the form of letter grades—is an important first step. Other states’ grading systems and their experiences improving them over time reveal three key steps state leaders can take to make North Carolina’s A-F grades a more meaningful reflection of the contributions of schools to the academic performance of their students, and to incentivize productive school-based action to improve school grades:
1. Adjust the formula by increasing the weight given to growth and adding factors research demonstrates lead to improved academic performance
General Assembly members have introduced welcome legislation to keep the current grading scale (A=85/B=70/C=55/D=40). Without the passage of that legislation, current law would move the grading scale to 90/80/70/60 effective this school year (2014-15). Unfortunately, legislators seem content to also keep the current formula for at least a couple more years. Doing so will achieve consistency while ignoring systemic flaws that are widely recognized even among proponents of A-F grades.
The sooner legislators act to address these flaws, the sooner we can start amassing consistent and reliable data under a grading system that’s more deserving of our attention.
Several bills filed this session would improve the formula by increasing the weight placed on growth or adding other factors linked to improved academic performance. House Bill 368 and Senate Bill 30 would shift the formula’s weights: the former to 20 percent achievement and 80 percent growth, and the latter to 40 percent achievement and 60 percent growth. House Bill 300 would give schools two separate grades, one based on achievement and the other on growth. And House Bill 624 would factor in student growth among the lowest-performing students at each school and additional criteria identified by the State Board of Education. Under this bill, school performance scores would be based 40 percent on achievement, 20 percent on growth, 20 percent on growth among the school’s lowest-performing students, and 20 percent on the State Board’s additional criteria.
Unfortunately, in a system like ours, the signal sent to schools is that their best chance of improving performance lies in enrolling more rich kids or serving fewer disadvantaged students.
Maintaining the current formula would result in a significant missed opportunity for those who believe A-F grades can be more than just labels. In systems like Florida’s and in the bills filed this session, letter grades increase the relative weight given to growth and in some cases mark clear paths for schools on how to improve their grades by assigning weight to a variety of measures that schools can control. Unfortunately, in a system like ours, the signal sent to schools is that their best chance of improving performance lies in enrolling more rich kids or serving fewer disadvantaged students. This is implausible for most public schools and in any case flies in the face of the best ideals of public education.
Among the areas legislators might consider adding to North Carolina’s formula are indicators of college and workforce readiness and of schools’ effectiveness closing achievement gaps. Some states’ systems include growth among a school’s lowest-performing students—as House Bill 624 would do in North Carolina. This approach rewards schools at all performance levels for serving disadvantaged students well. Finally, because both achievement and growth scores rely so heavily on test scores, North Carolina has an opportunity to pioneer the inclusion of school performance factors that address currently untested grades and subjects, and aspects of student learning that are not adequately captured by today’s standardized tests.
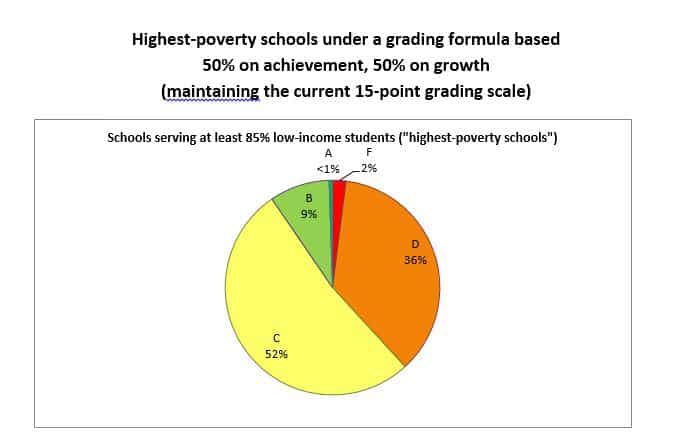
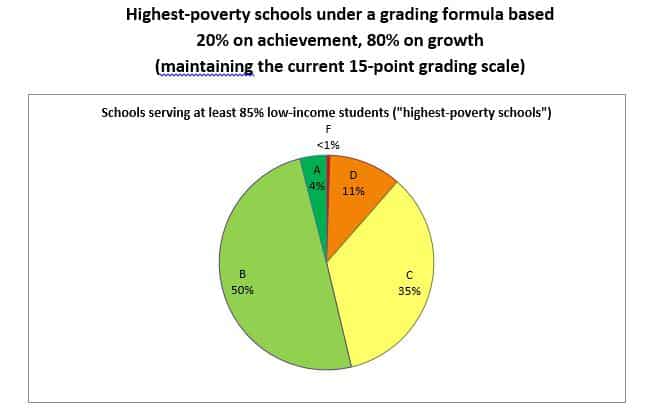
The table below shows the percentages of all district and charter schools that would have earned each A-F grade, based on 2013-14 data, under the current system and each of five alternatives. The first two columns show the current formula, with the current scale and the 90/80/70/60 scale that will kick in this year unless the legislature passes pending legislation to keep the current scale. The next two alternatives show what last year’s school grades would have looked like under a system based 50 percent on achievement and 50 percent on growth. The last two alternatives show the same grades under a system reversing the current weights, basing school grades 20 percent on achievement and 80 percent on growth.

This table reveals the significance of the legislature’s pending action to maintain the current 15-point grading scale.
If the 10-point scale had been in place this year when the first A-F grades were released, more than 70 percent of schools statewide would have received D’s or F’s.
Only two percent would have received A’s.
Would changes to the formula eliminate the impact of poverty on school grades? Not by a long shot. However, as the charts below illustrate, moving to a formula that weights growth at 50 percent or higher would blunt the impact somewhat by tagging lower percentages of high-poverty schools with D’s and F’s. And more importantly, it would put more of the grade’s weight into factors over which schools have more control.
2. Analyze and publicize lessons learned from schools that are beating the odds by earning high grades while serving high percentages of low-income students.
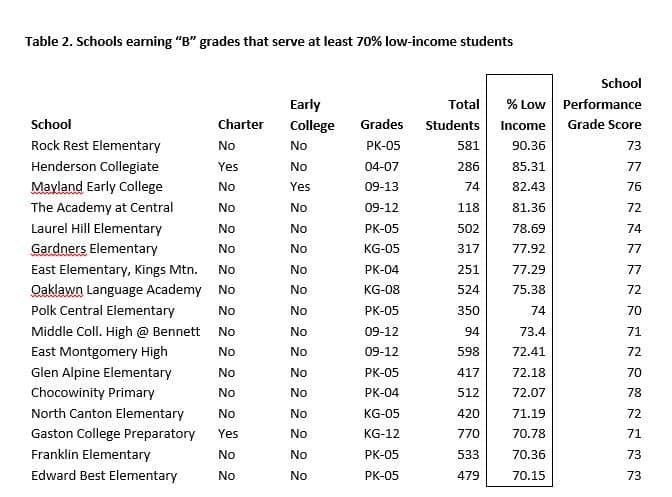
Our grading system is so strongly linked to non-school-based factors that it may have little to teach us about what can be done at the school level to improve student outcomes. However, even in this imperfect system, we can learn valuable lessons from the schools that are succeeding in spite of the grading formula’s systemic biases. In particular, it is worth examining school-level practices at schools that earned high grades while serving high percentages of low-income students. The following tables list schools that earned A grades based on 2013-14 data while serving at least 50 percent low-income students, and schools that earned B grades while serving at least 70 percent low-income students.
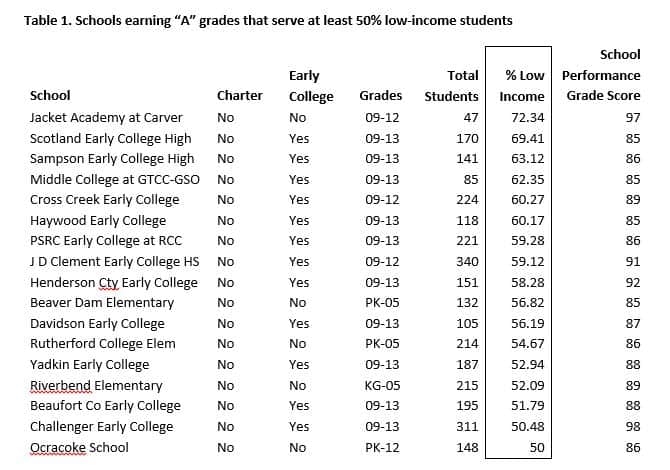
We can make a couple of high-level observations about these schools. First, the majority of schools that earned A grades while serving at least 50 percent low-income students were Early College High Schools (12 out of 17). These schools were formed through a partnership among the North Carolina Department of Public Instruction, the North Carolina Community College System, the University of North Carolina, the North Carolina Independent Colleges and Universities, and North Carolina New Schools. For more information about the Early College High School Initiative, see Changing the Future through Early College High Schools.
Second, while relatively few charter schools appear on the lists (two out of 34 total schools), they nevertheless enrolled 10.7 percent of the students served by schools on the list, higher than the percentage of students charter schools serve statewide (3.8 percent in 2014). This is because one of the two charter schools—Gaston College Preparatory School—enrolled 770 students, more than 2.5 times the average.
Beyond these basic details, it will take much deeper analysis of school-based practices and the quality of teachers, school leaders, and school cultures at these schools to uncover crucial lessons learned. EdNC has written about plans to visit high-performing, high-poverty schools and write profiles about them. Through analyses like theirs, we may be able to gain some helpful insights in spite of the broader biases of the grading formula.
3. Target supports to the lowest-performing schools
Under any system, school grades beg the question of what the state and other actors plan to do to address persistently failing schools. In one view, the answer to this question begins and ends with transparency and resulting parent choice. If parents in D and F schools know how bad their schools are, the theory goes, they will demand and pursue other publicly-funded options, including magnet and charter schools, and private schools through voucher programs. Some also believe that the presence of school grades and the threat of a student exodus from failing schools will create a competitive atmosphere that will push failing schools to improve.
A more complete response is to acknowledge that, particularly in a system where school grades correlate strongly with poverty, persistent low grades signal a need for intensive support rather than abandonment or simple reliance on market dynamics. Support might include programs that attract and retain excellent teachers in D and F schools; autonomies granted to school leaders at persistently low-performing schools over such crucial variables as school calendars, staffing, budgets, and curricular decisions. Finally, like North Carolina’s state supplemental funding for small and low-wealth counties, special funds could be established to target additional per-pupil funding to schools that earn the lowest grades, and the funds could be earmarked for specific uses (e.g., teacher recruitment and retention incentives; job-embedded professional development alternatives; and wrap-around services and support) and other existing evidence-based interventions.

Recommended reading