North Carolina public schools showed progress on school and student performance during the 2024-25 school year, according to new data released by the N.C. Department of Public Instruction (DPI) on Wednesday.
According to DPI, “North Carolina students achieved a three-year high in most standardized tests at the end of the 2024-25 academic year,” and school performance grades “continue to show an increase of schools earning an A, B or C, while the number of schools earning a D or F declined by nearly two percentage points.”
“I’m proud of our students and educators who have worked hard to improve these metrics even as we acknowledge that our students are more than test scores,” state Superintendent Mo Green said in a press release. “While the progress and growth shown in these reports deserves praise, we must continue our work to promote excellence for all students. Our plan is to Achieve Educational Excellence — for every child in North Carolina and to have the best public schools in the nation. I am eager to see this data continue to improve as we work to implement our strategic plan.”
![]() Sign up for the EdDaily to start each weekday with the top education news.
Sign up for the EdDaily to start each weekday with the top education news.
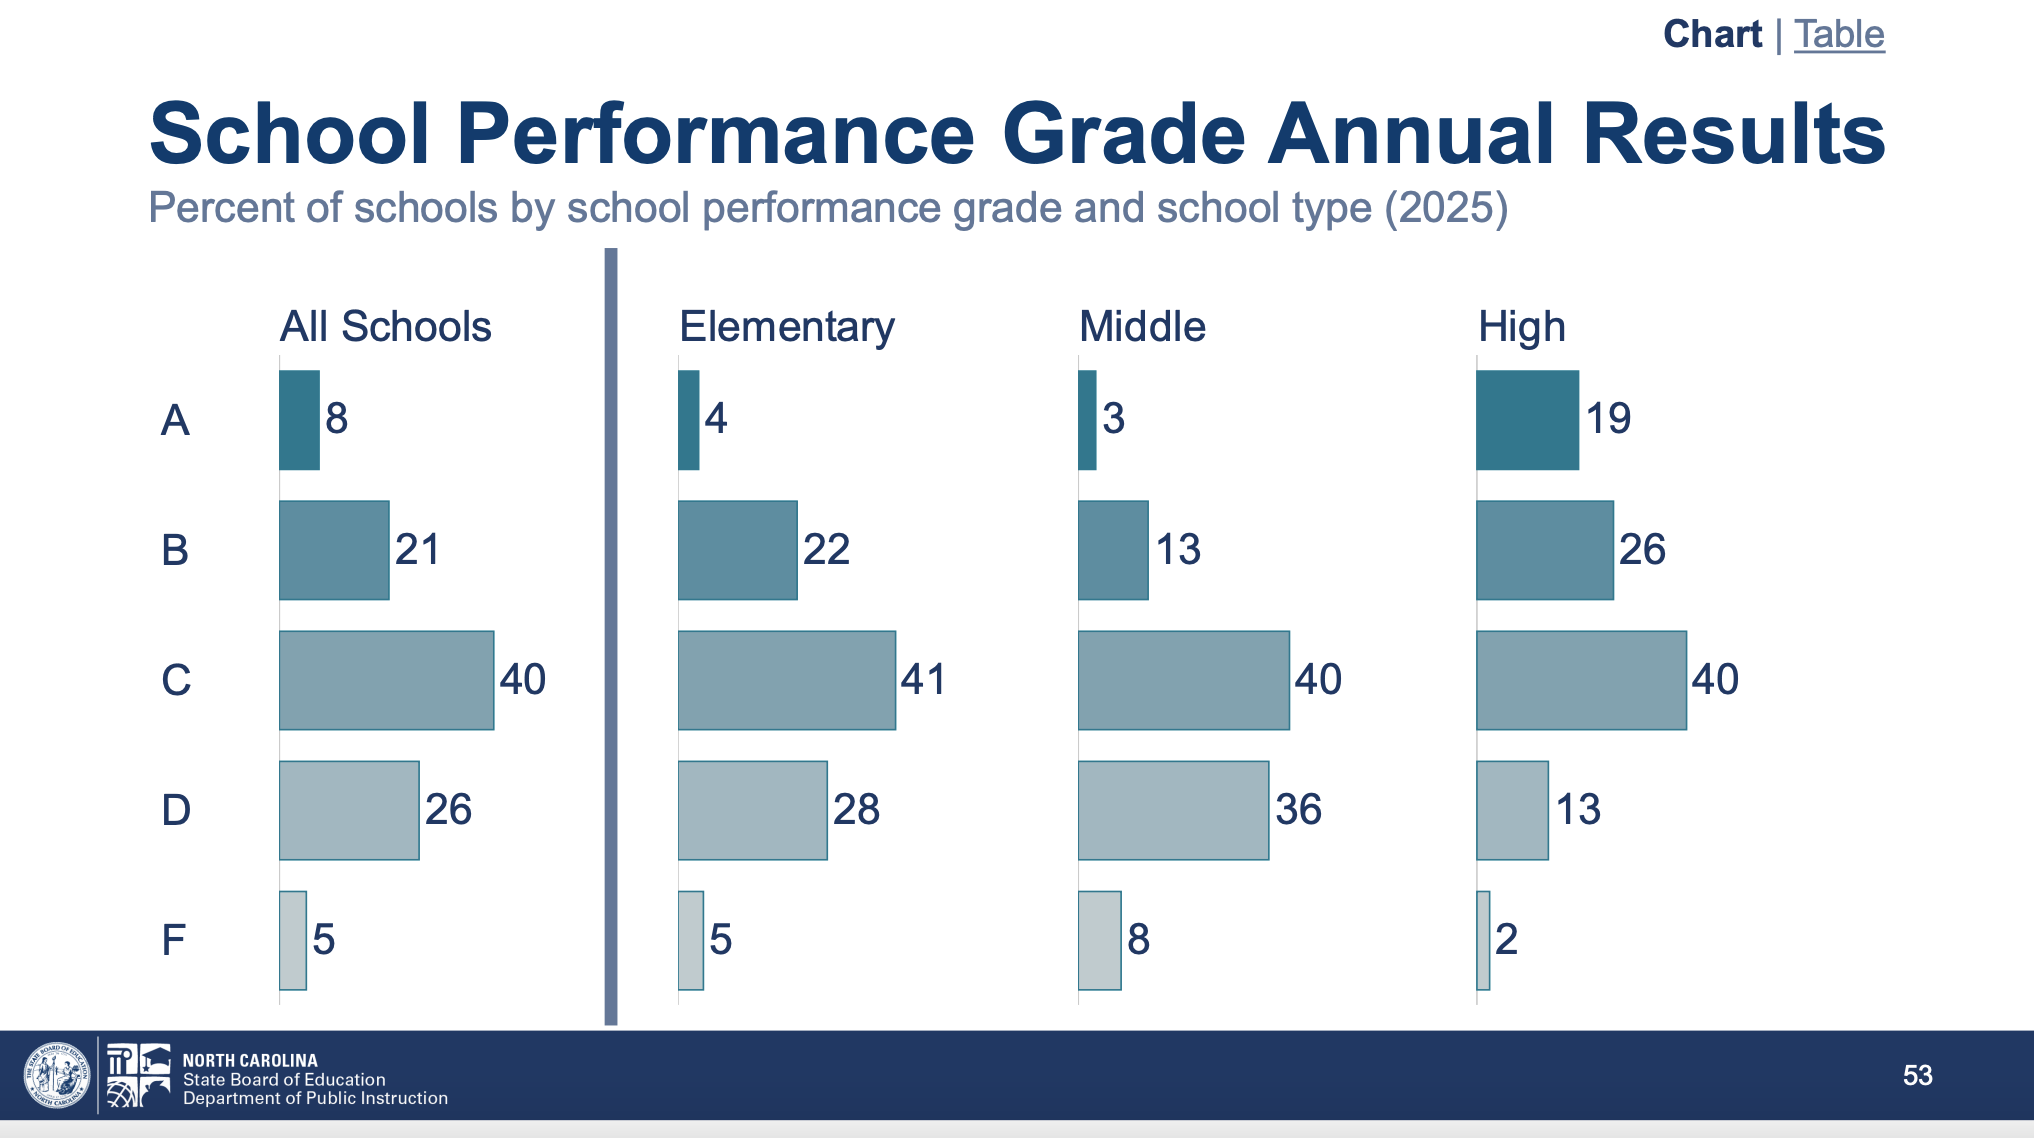
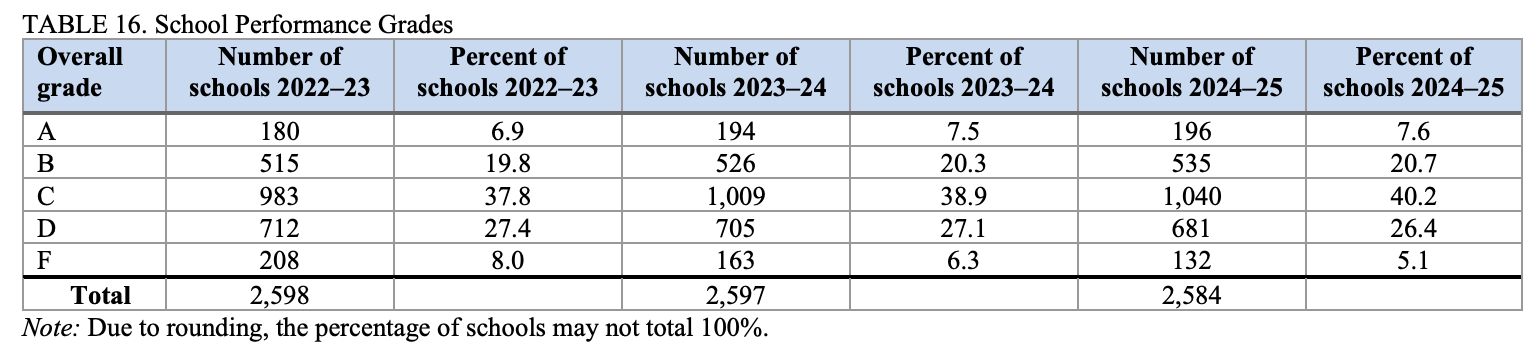
According to the new data, more than one in four schools received an A or B during the 2024-25 school year (29%), and nearly three-fourths of schools met or exceeded growth during the same time period (71%). Only 5% of North Carolina schools received an F grade.
In North Carolina, school grades are based on each school’s achievement score (including standardized test grades), weighted 80%, and on students’ academic growth, weighted 20%. Education leaders have long said that formula does not capture the full picture of the work happening in the state’s public schools.
The grade designations are set on a fifteen-point scale: A = 85-100, B = 70-84, C = 55-69, D = 40-54, and F = 39 or less.
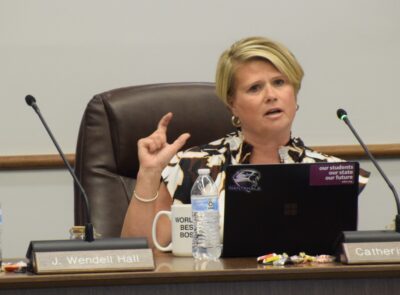
Over the last few years, and under the leadership of former state Superintendent Catherine Truitt, DPI advocated for state lawmakers to change how school performance grades are calculated to account for more factors than achievement and growth. While lawmakers initially showed interest in DPI and Truitt’s plan, they never passed legislation changing the formula.
“Over-reliance on tests and school performance grades can misrepresent school quality and mask both the growth and achievement of our students, as well as the challenges and obstacles they face,” State Board of Education Chair Eric Davis said when the data was released last year. “Let’s use this data, not as a myopic judgment of school quality, but instead to inform and rededicate ourselves to our students and North Carolina’s public schools.”
The current measure of school performance grades has been reported for every North Carolina school since the 2013-14 school year, per the report.
Student standardized test scores account for the bulk of each school’s achievement score, which is 80% of a school’s score. Other factors included in this score are the percentage of English learners who meet the progress standard on the English proficiency assessment, and the percentage of students who graduate within four years of entering high school.
School growth is calculated through the EVAAS model, which according to DPI, “uses current and previous student test scores to determine whether schools are maintaining or increasing student achievement from one year to the next. If a school does not have a Growth Score, only the School Achievement Score is used to calculate the Performance Score.”
Here is the dashboard where you can find school performance grades.
Under “Select a group of schools,” a drop-down menu will allow you to choose a district or pick charter, laboratory, or regional.
To explore a specific school’s report, click on the drop-down menu under “See results for this school” to select the school you are interested in.
In the upper left hand corner, you can see the school grades from 2022 to 2025. Note that growth now shows up as a numeral.
Here is DPI’s press release.
Here is where all the data lives. Click on documentation to see the background brief, for example. Click on reports to see the low-performing state designations. Here you can find zip files for disaggregated data, which download as text files. We converted that to an excel file.
And here is the annual testing and performance report. Below, you can find a look at school performance grades over time, starting in 2022-23.
More on school performance grades
In North Carolina, schools that receive a score of D or F and don’t exceed growth are considered “low performing.” Low-performing districts are districts where more than 50% of schools are identified as low performing. Continually low-performing schools are schools identified as low performing in any two of the last three years.
The number of low-performing schools decreased by 49 schools last school year, according to DPI’s data, and the number of low-performing districts stayed the same, at 23. There were 60 fewer continually low-performing schools and nine fewer continually low-performing charter schools.
In 2024-25, 31% of schools received a score of D or F — a decrease from 33.5% in 2023-24 and 35.4% in 2022-23.
Across the state, some education leaders push back on the deficit focus of the “low-performing” framework.
Dr. Anthony Jackson, superintendent of Chatham County Schools, has said his district makes an effort to recognize that there are high-performing students in every school, regardless of low-performing status. Additionally, he said schools should always center individual student needs, rather than a school’s overall ranking.
His district has also reframed the “low-performing” designation with different language.
“In Chatham County Schools, we avoid labeling schools as ‘low performing.’ Instead, we identify them as ‘Schools in Need of Support,’” Jackson previously told EdNC. “We collaborate with these schools to create targeted plans, leveraging their strengths and best practices while providing extra resources to address specific areas of improvement. As a school leader, I emphasize the power of words and a growth mindset.”
Typically, after DPI releases its school performance data, schools and districts have two weeks to review the data to make any corrections.
Impact of Hurricane Helene
This year, for schools providing end-of-course fall testing, a waiver was granted by the U.S. Department of Education due to the loss of instructional days because of Hurricane Helene.
“Under this waiver, fall end-of-course tests were excluded from school performance grades and the long-term goal calculations,” DPI’s presentation said.
Three North Carolina schools districts and one charter school opted into this waiver, impacting 10 total schools. For these schools, performance grades will only be based on spring testing results.
“For all schools affected, the loss of instructional days will be noted on data reports, accountability reports and the NC Report Card,” the DPI release said.
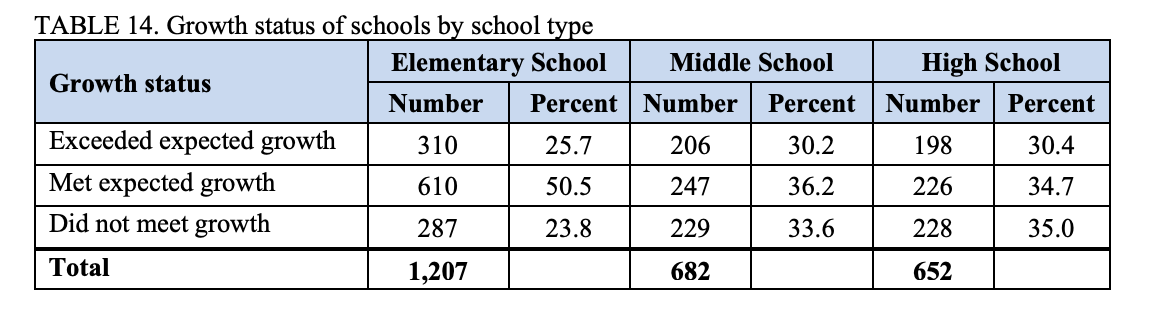
A look at growth
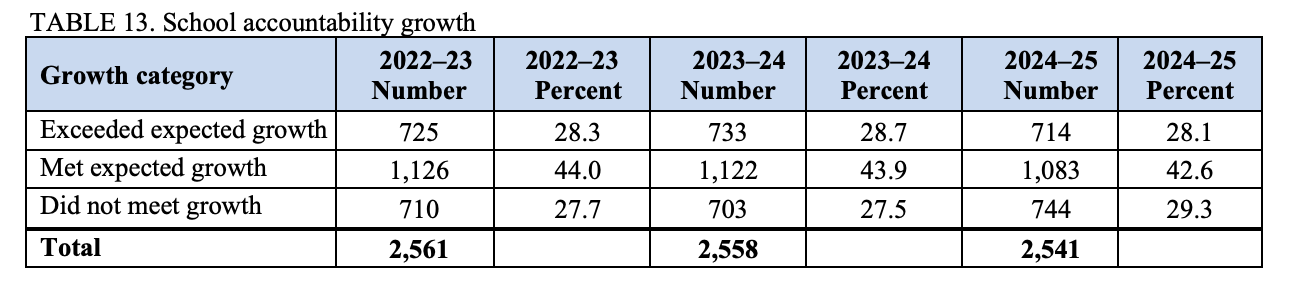
During the 2024-25 school year, 1,797 schools met or exceeded growth (70.7%). This is down slightly from the previous school year, when 73.1% of schools met or exceeded growth.
The table below shows the growth rate of North Carolina’s schools over time. Note that because school growth only makes up 20% of the composite performance score, some of the schools which met or exceeded growth could still have received a “D” or “F” grade.
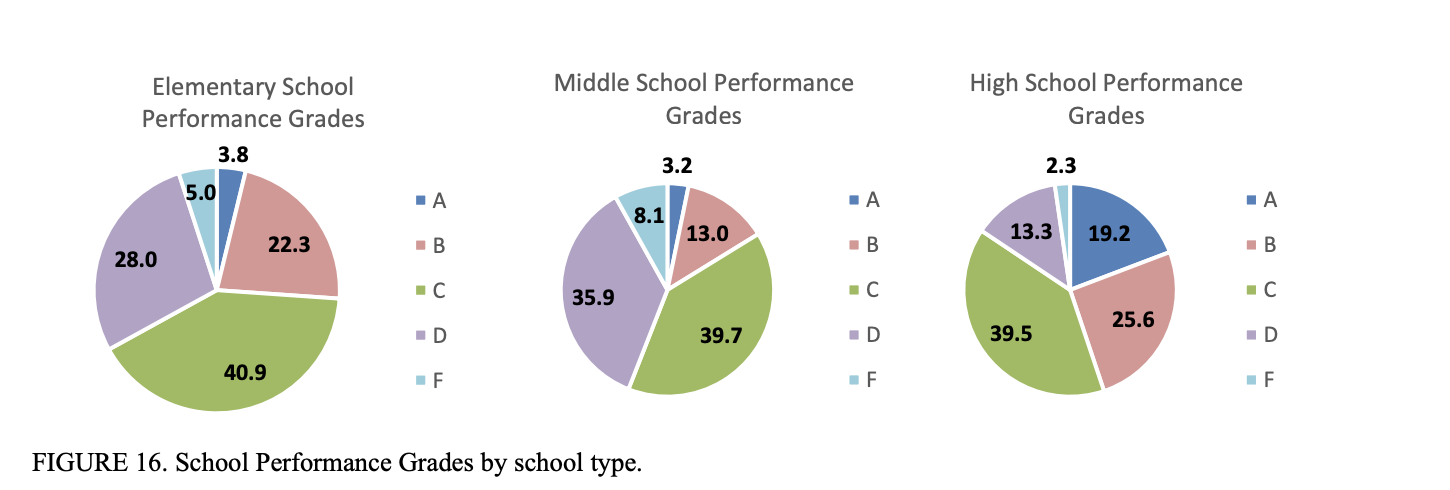
The report also separates school performance grades by school type — elementary, middle, and high.
High schools have a larger proportion of schools with grades of A or B. However, high schools have more indicators than middle and elementary schools because high school students take a larger number of standardized tests.
Subgroup data
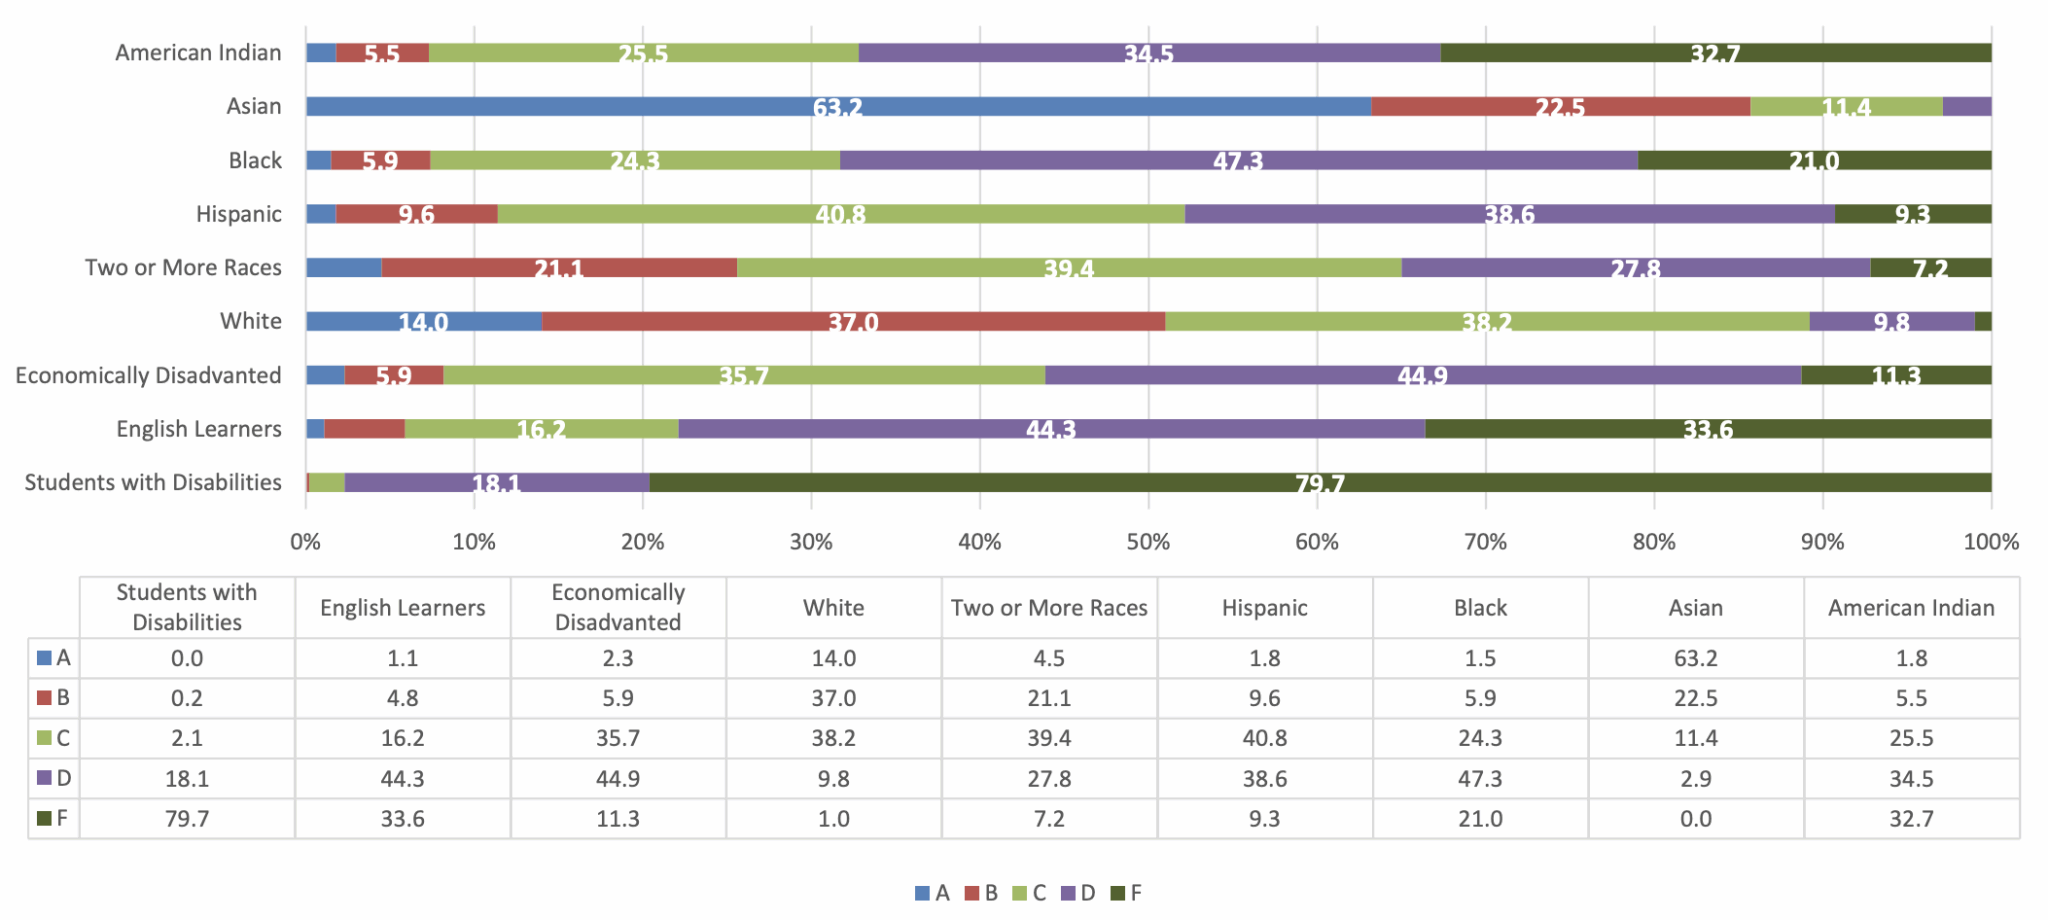
The DPI report also includes analysis for student subgroups, including students with disabilities, English learners, economically disadvantaged students, and white, Hispanic, Black, Asian, American Indian, and biracial or multiracial students. To receive a letter grade, a subgroup must have 30 students in membership in the school.
According to the data, white and Asian subgroups perform at a higher rate than schools overall, while other groups perform at much lower rates. This is consistent with DPI’s test score data, also presented to the Board on Wednesday.
The percentage of English Language Learners (EL) who meet their progress targets is also included in a school’s performance grade.
New EL exit standards were implemented for the 2024-25 school year, with the composite score required to exit EL status changing from 4.8 to 4.5.
During the 2024-25 school year, 35.2% of EL students met targets, up from 27.3% in 2023-24. Students qualifying to exit identification as an English learner increased from 6.9% for the 2022–23 school year to 13.0% for the 2024–25 school year, the report says.
More on testing results
The 2024-25 state test results, which were also presented to the Board on Wednesday, show that 55% of students passed state exams last school year, up from 54.2% the prior year but still below the pre-pandemic proficiency rate of 58.8% in the 2018-19 school year.
While overall performance is still down from pre-pandemic levels in 2018-19, students have seen gains each of the last four years.
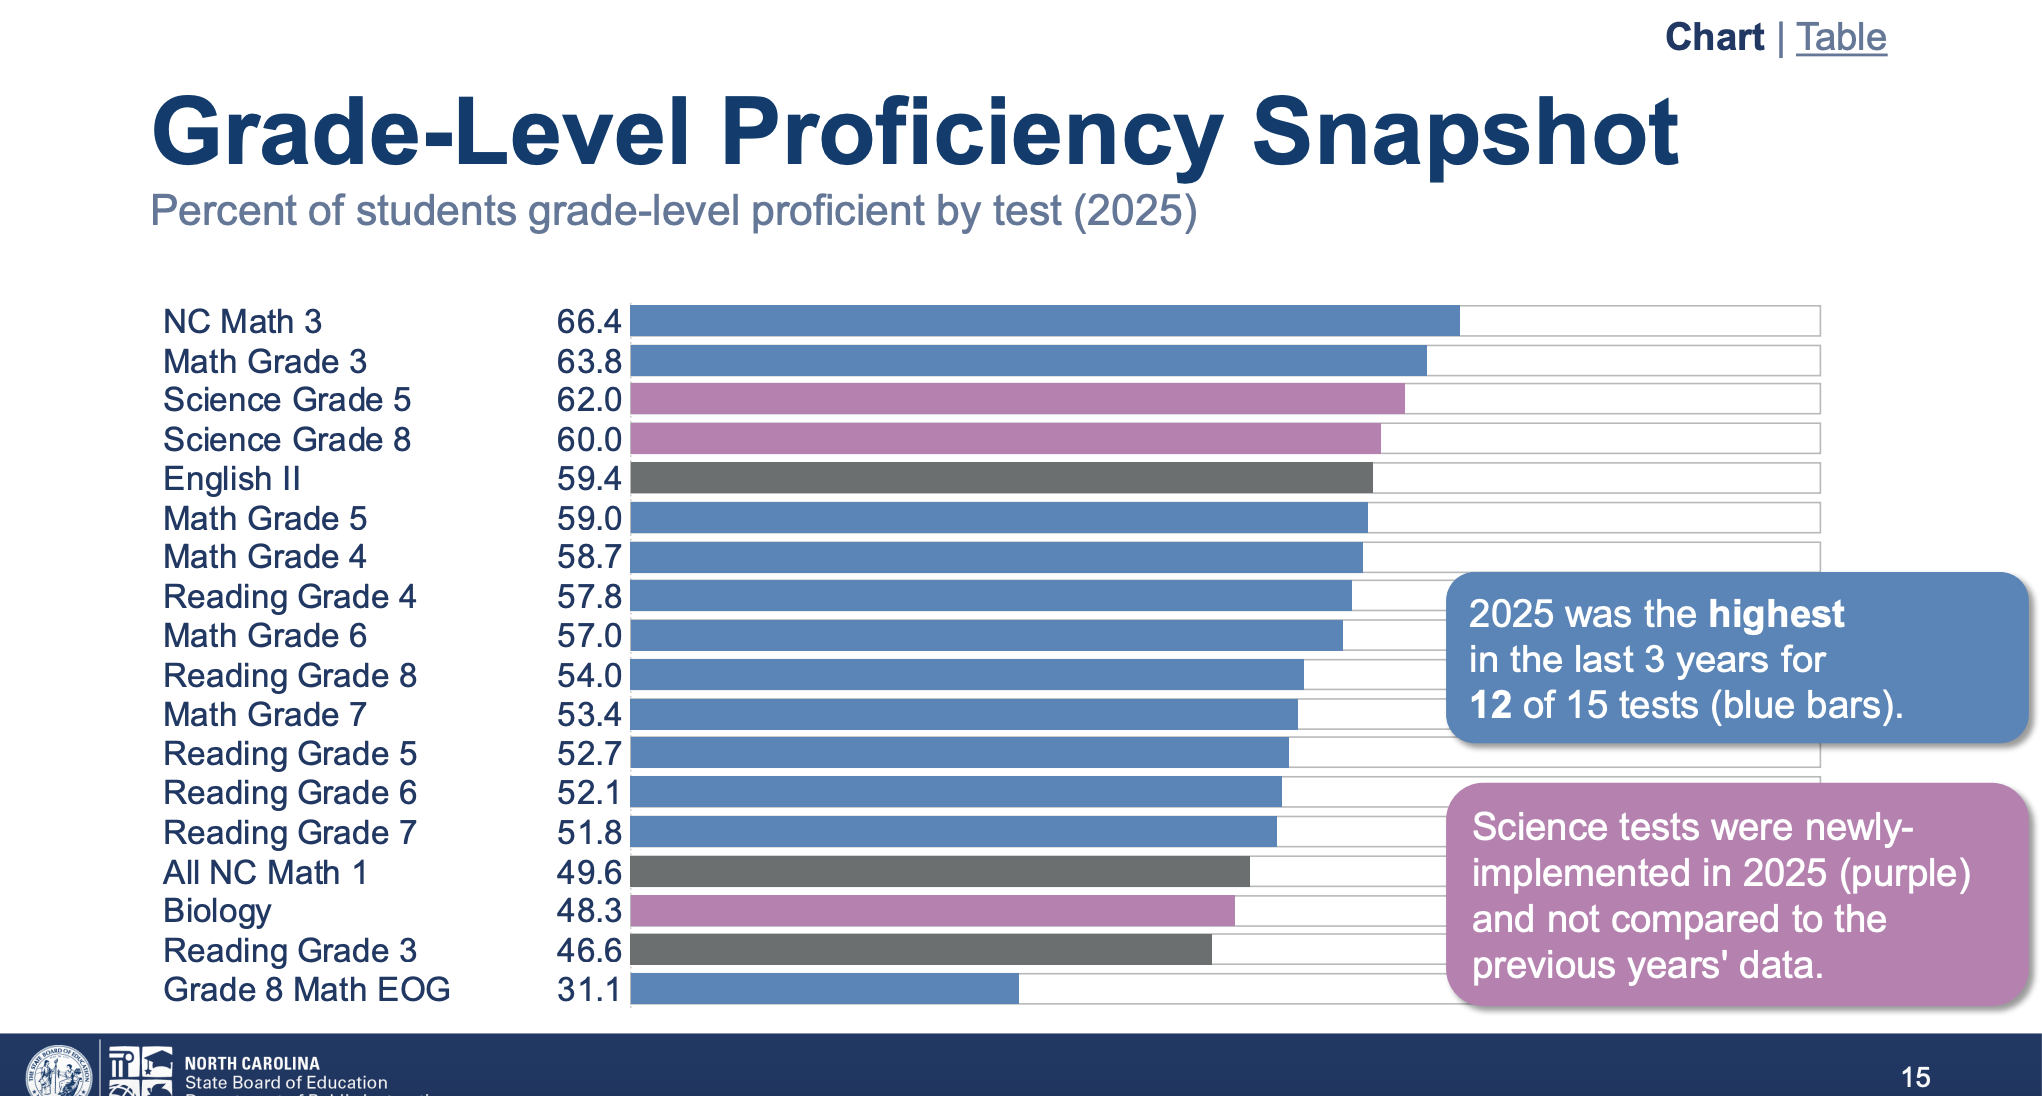
In North Carolina, students who receive a score of a Level 3 or above on end-of-course and end-of grade exams are considered “Grade Level Proficient” (GLP). Students who earn a Level 4 or above meet the Career and College Readiness (CCR) standard.
Here is a look at students who were GLP on the tests.
And here is a look at students who were CCR on the tests.
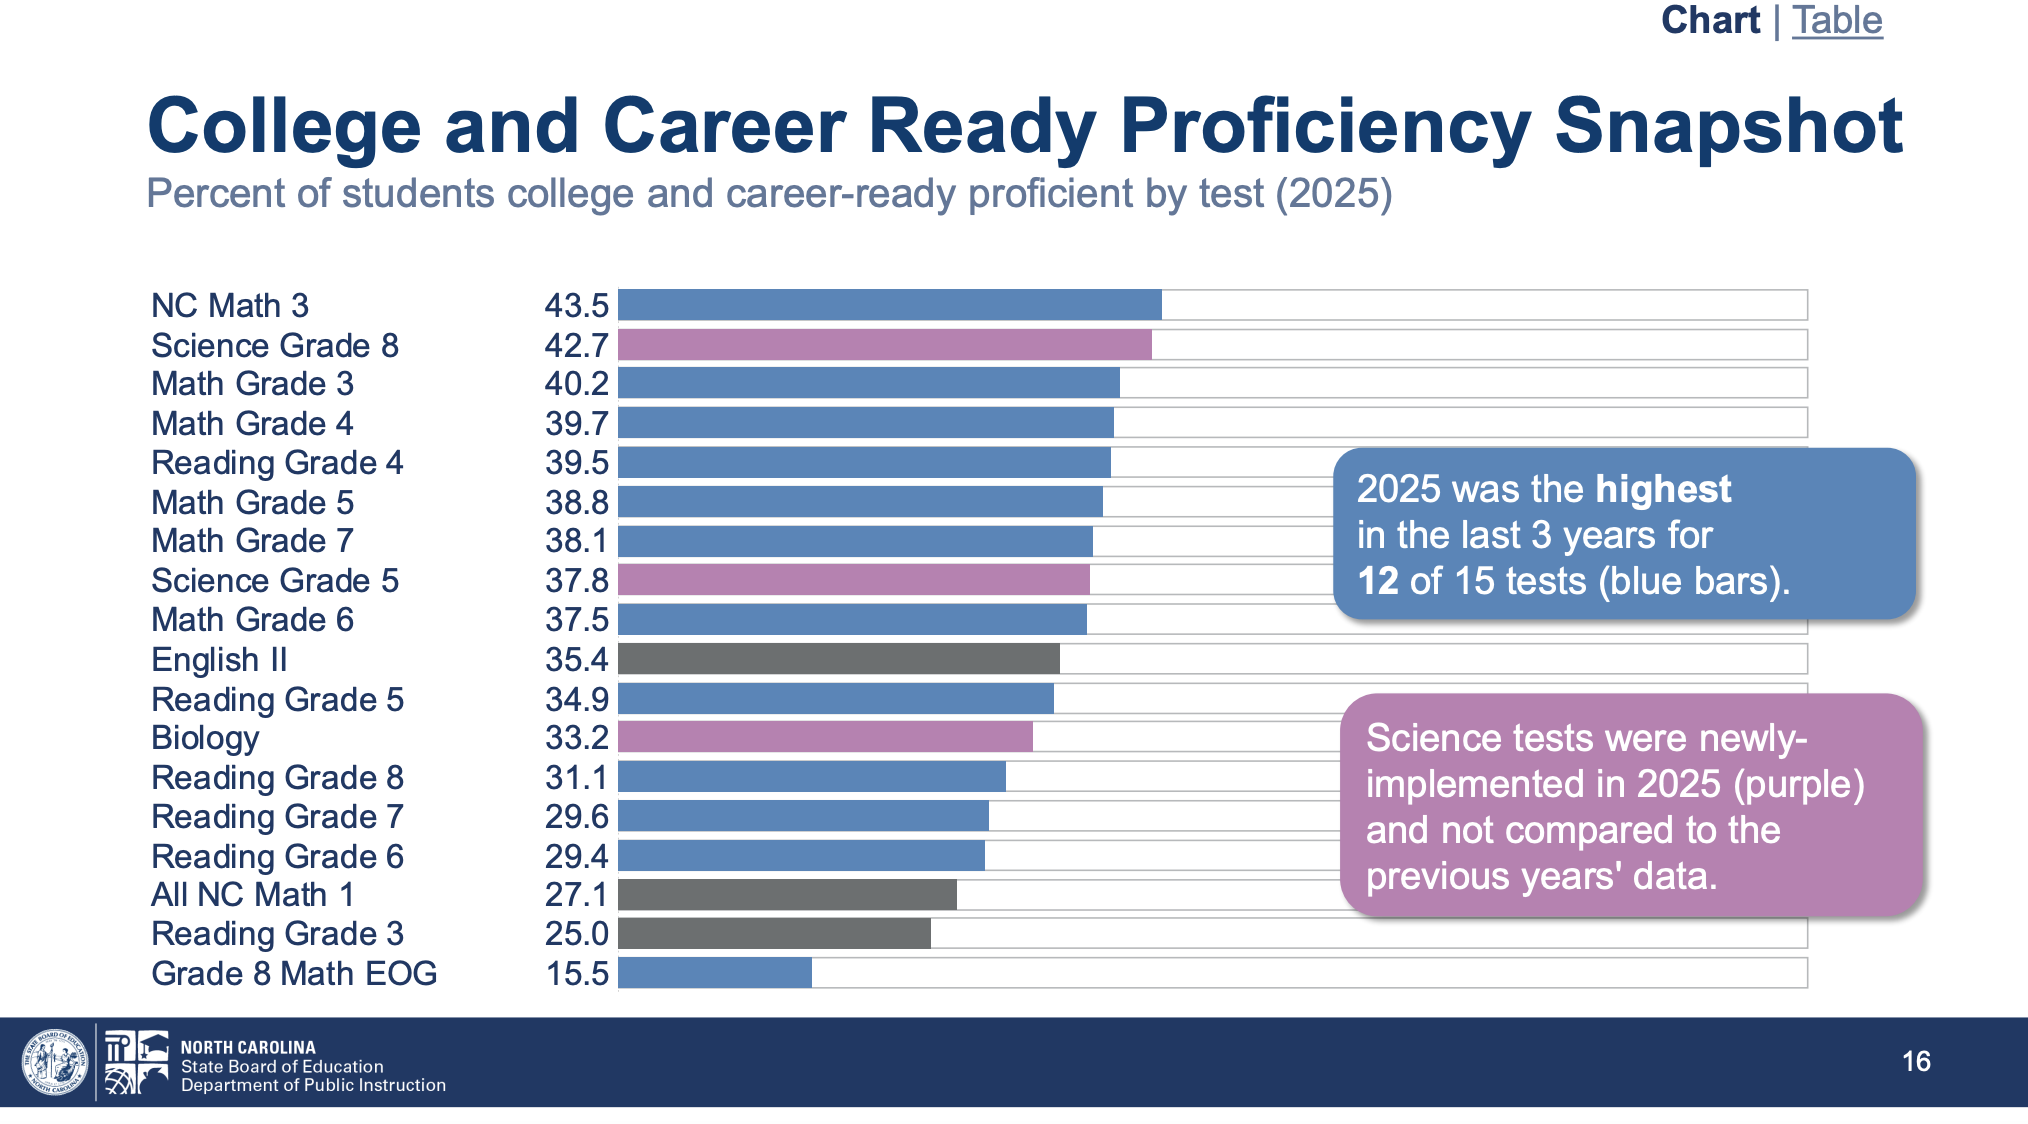
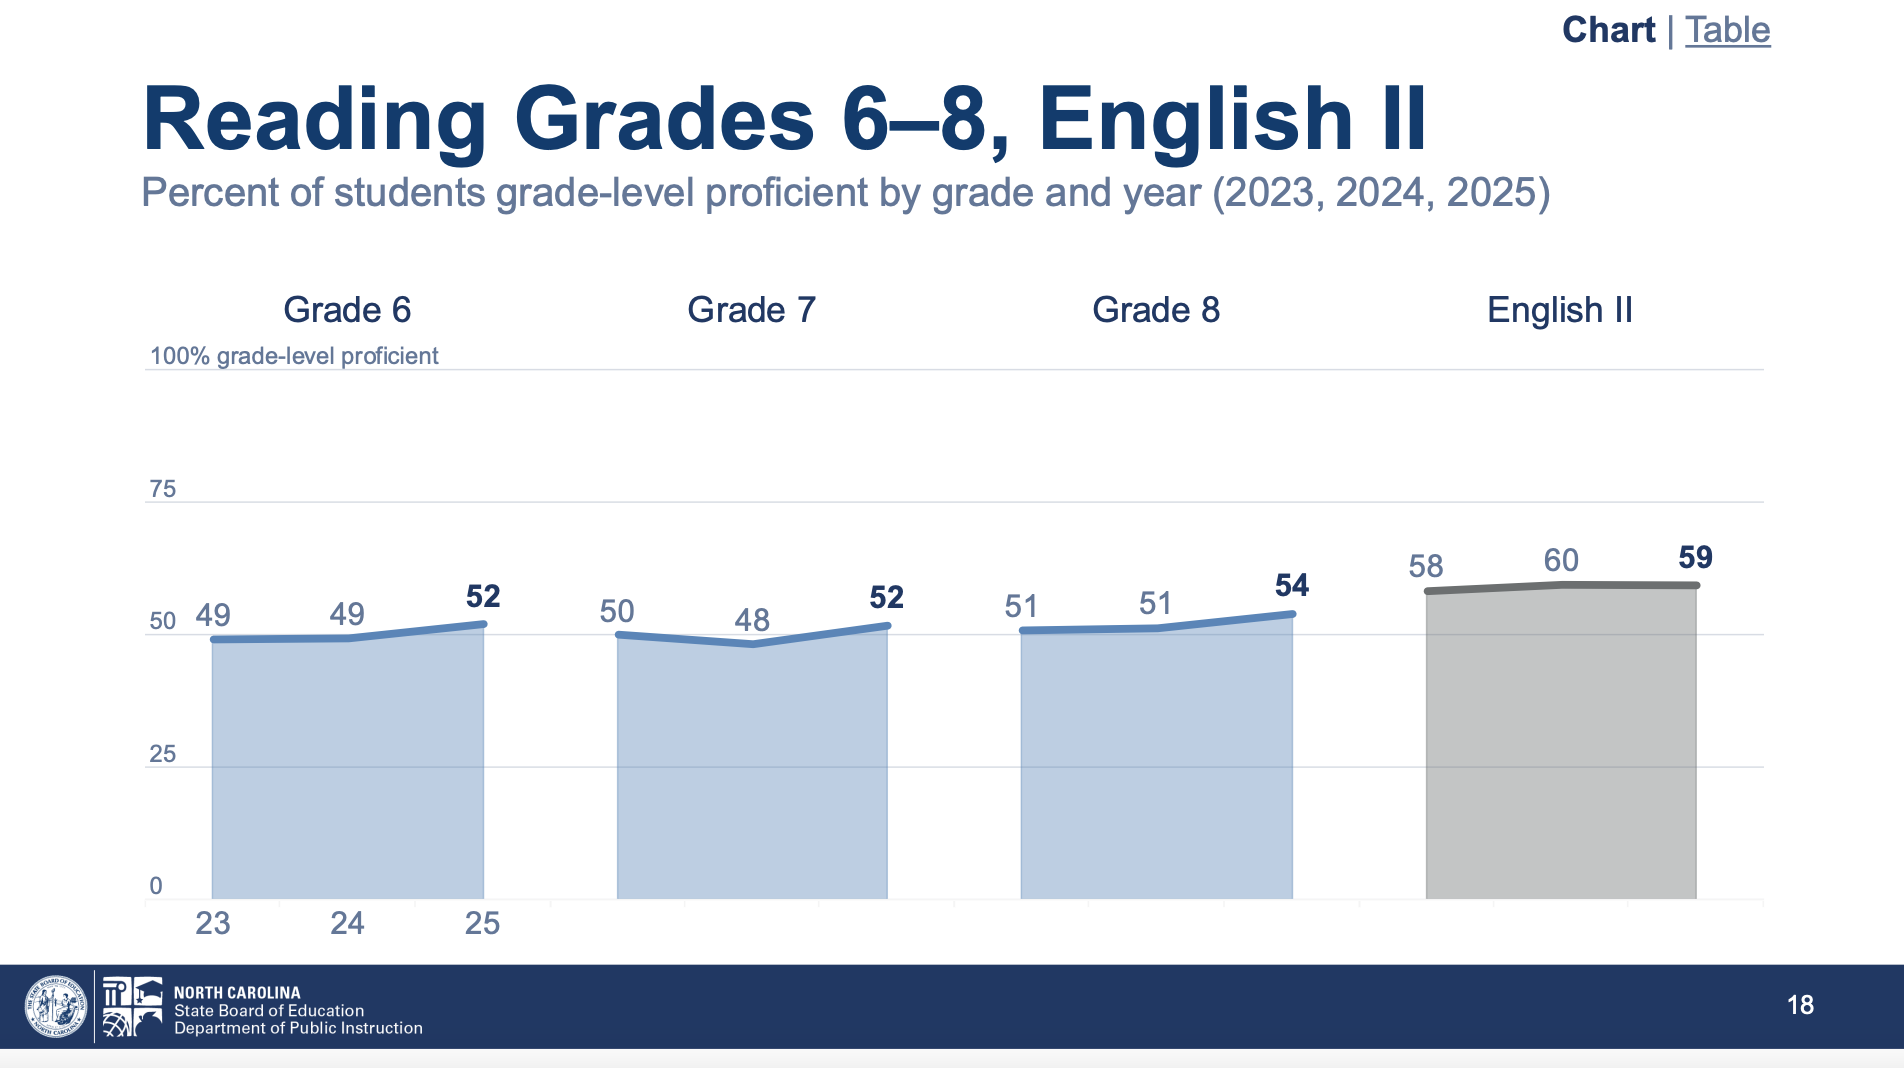
Students scored higher in 12 of 15 math and reading assessments in 2024-25, according to DPI, with only third grade reading, English II, and NC Math I showing declines compared to the 2023-24 results.
The average composite score for 11th graders taking the ACT, a college readiness test, increased to 18.2 in 2024-25 from a slight dip of 18.1 the previous year.
In the press release, DPI said: “Demonstrating alignment to Pillar I of the Strategic Plan, Prepare Each Student for Their Next Phase in Life, new data shows that the four-year cohort graduation rate has also risen to 87.7%, up from 87.0% in 2023-24, and is the highest in the past 10 years.”
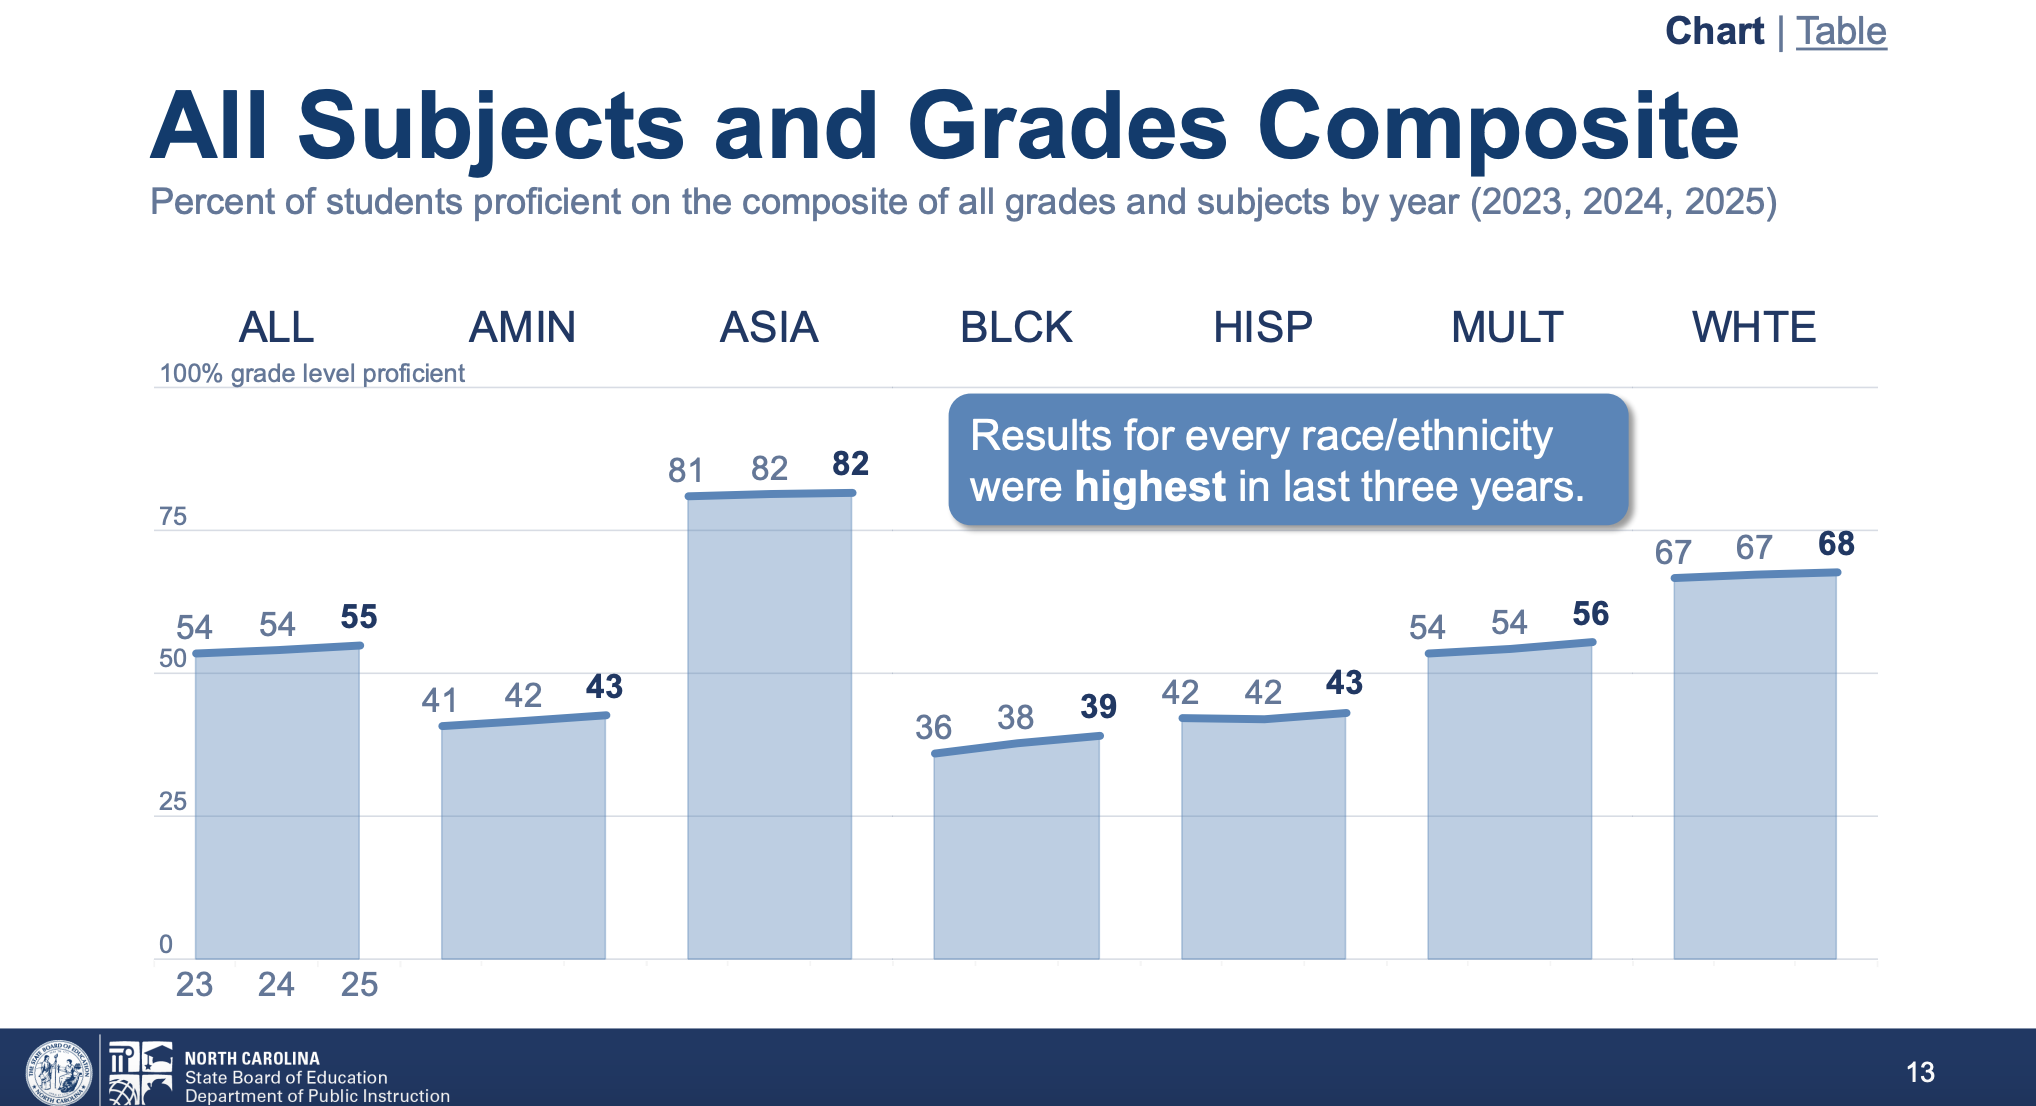
Additionally, DPI said composite results for all race/ethnicity subgroups were the highest in the last three years.
You can view DPI’s full presentation of student test results starting on slide 9.
Opportunities for growth
The DPI presentation identified third grade reading as an area to improve moving forward, along with overall reading comprehension focus, and improvement in achievement in reading and math “across various subgroups of students.”

This year is also the first that tests were aligned to new content standards in science and biology. DPI said “results should not be compared to previous years.”
The presentation said “with new science assessments’ baseline, support instruction, particularly with the inclusion of science and engineering practices,” is an opportunity for growth.
Green said the 2024-25 accountability results should be built and improved upon in order to “make North Carolina public schools the standard of excellence.”
“The goal of the Strategic Plan is that North Carolina’s public schools will be the best in the nation by 2030,” he said. “The measures and actions in our joint strategic plan with the State Board of Education provide us with the roadmap to build on the incredible hard work and diligence of students and educators across the state identified in these results.”
You can view the full report on testing results and school performance grades here.

Recommended reading