
North Carolina, you have a big anniversary next year. 2016 marks 20 years of charter schools in the state, and as with most significant milestones it is an apt time to pause and reflect.
When it comes to charter schools in North Carolina, despite two decades of experimentation and execution, the state’s relationship with charters has felt more like a cautious courtship than a full-blown marriage.
Some think that’s a good thing, but as with most issues surrounding charters, there’s little consensus one way or the other.
Since Minnesota became the first state in the country to authorize charters in 1991, the concept has become a flash point in the philosophical divide regarding the purpose of public education. Does personal choice trump the common good? Or is that just the false dichotomy that has hijacked our public debate?
Yet for such a sensitive and divisive topic — one that seems to steal the air from our conversations about public education and education reform — charter schools and charter students remain only a fraction of the public school student population in this state and around the country. There are exceptions, of course, in places like New Orleans, where upwards of 93 percent of students are in a charter school, but for the most part, the market share is still a relatively small one.
But that is changing. And the potential pace of that change could be anxiety inducing for underprepared and ill-equipped school districts and states.
According to the National Center for Education Statistics, charters schools have grown from 1.9 percent of public schools in 1999-2000 to 6.2 percent in 2012-2013, for a total increase of 4,600 charter schools across the nation.1 In that same time span, the number of students attending charters increased from 300,000 to 2.3 million, which outpaced the 900,000 increase in traditional public school students for the same time period.2
A report earlier this year by the National Association for Public Charter Schools, a nonprofit advocacy group for public charters, estimates that growth pattern has continued since 2013. The report estimates that enrollment in the nation’s charter schools has increased by an additional 348,000 students from 2013-2014 to 2014-2015, for an estimated total of 2.9 million students enrolled in one of the nation’s 6,700 charter schools.3
The report points out that in the same period as the estimated 14 percent increase in charter enrollment, an estimated 200 charter schools closed their doors.4 The estimates do not capture the fluidity of student movement from public to charter or vice versa, or the flow of students from one charter to another.
Perhaps the most exhaustive survey of charter research available is a 144-page “Charter Schools in Perspective: A guide to research” report from the Spencer Foundation and Public Agenda.
The report notes that it is not easy to generalize to charters. We know the very model of a charter school is one that theoretically makes room for independence and innovation in the traditional model of public education. Added to that are a patchwork of state laws and regulations governing charters from one place to another, all with varying levels of oversight, and even different management structures that can cross state lines.5 So while the report does identify common themes from the literature and research in the field, it is at times forced to make sense of competing and somewhat contradictory findings.
For example, the report states that “nationally, there is very little evidence that charter and traditional public schools differ meaningfully in their average impact on students’ standardized test performance,”6 yet it goes on to note that when a study can “disentangle some student subgroup and locale impacts” exceptions emerge.7
And on other measures of academic performance, the report notes that “there is comparatively little rigorous research comparing charter schools with traditional public schools on measures of academic outcomes other than standardized test scores, such as indicators of academic engagement and motivation, high school completion, college matriculation, graduation and so on.”8
On the topic of diversity, the authors found that “on average, charter schools nationwide tend to enroll a larger proportion of African-American students and students living in poverty than do traditional public schools nationwide” but that “varies from school to school and district to district” and that the “picture becomes even more complex when comparing the demographics of charter school students to those of their peers in nearby traditional public schools.”9
The report cautions that “[i]mportant questions about charter schools are often difficult to answer because data do not exist, are hard to access or hard to compile.”10
Welcome to the maddening world of charter school data.
The struggle is no fault of the authors or the studies they are analyzing. Rather it gives credence that with charters, place matters.
Because charters differ depending upon the philosophy, location, and student population, it may be best to avoid the urge for generalizations and instead examine what’s happening in individual states and communities, to see how specific locales have dealt with the growth of charter schools.
EdNC recently did a scan of charter school reports published by member organizations of the Governmental Research Association (GRA). The GRA is a national association of individuals and organizations involved in local, state, and federal governmental research and study. The nonpartisan organization “… works to foster the establishment of governmental research agencies, aid and coordinate the activities of governmental research agencies, facilitate the exchange of ideas and experiences among the professional staff of such agencies, and undertake other related activities.”
Many of the reports scanned below are extensive and lengthy and offer an incredible amount of detail into local charter schools in three cities (Chicago, Milwaukee, and New Orleans) and three states (New York, Utah, and North Carolina). We include in this group a report from the Office of the Controller in the City of Philadelphia. Each of these reports, as well as other reports used as background for this article, are included in the bibliography below, to allow for a deeper dive into a specific locale or report.
Chicago
The Civic Federation, a nonprofit and nonpartisan Chicago-based research organization, did a two-year analysis of charter school finances in that city. The 2011 report notes that for the 2007-2008 school year, Chicago had 30 charter schools on 68 campuses with close to 23,000 students enrolled, accounting for more than five percent of all Chicago Public School students.11
Overall, the report found that most of the city’s charter schools were in “good fiscal health” and “successfully met key standards of fiscal accountability.”12 According to the report, 20 of the charters examined spent 80 percent of school expenses on “program-related services.”13 Program-related expenses are costs related to the “direct mission-related work or direct service expenses” of a nonprofit, meaning that the vast majority of school funds were not spent on overhead, including administration or facilities.14 The report notes that the figure is “very high” and indicates school dollars were “overwhelmingly spent on direct service versus administrative and other activities.”15
The report also performed an “instructional expense analysis,” a measure of how many charter dollars go directly to instruction-related expenses. According to the report, the median percentage for charters was 65 percent for classroom-related expenses in FY 2007 and 63 percent in FY 2008.16
All the city’s charters received clean audits for fiscal years for FY 2007 and FY 2008 and all the schools measured received positive ratings in all categories of its financial operations analysis, a method to determine if the schools “adhere to sound budget and finance practices.”17
The vast majority of revenue for the city’s charters came directly from the Chicago Public Schools. In FY 2007, local funding accounted for almost 69 percent of charters’ revenue. That figure climbed to 71.5 percent in FY 2008.18 School-based funding was the next largest revenue stream in both years, accounting for 21 percent of funding in FY 2007 but dropping to almost 15 percent in FY 2008.19 The report defines school-based funding as “grants, donations, contributions and the proceeds of various fundraising efforts.”20 State funding was the third-largest revenue stream in both fiscal years, just over seven percent in FY 2007 and 11 percent in FY 2008.21
It’s difficult to read the report and not come away impressed with the overall financial health and management of Chicago’s charters. However, there were some negatives, one of which was an increase in the number of charters with declining or negative budgets from FY 2007 to FY 2008. But taken in the aggregate, the data presented indicates a well-managed system.
But there are qualifiers. The report notes that the data presented is only a “snapshot of financial performance at a point in time” and that there are “often extenuating circumstances regarding the situation of individual organizations.”22
Perhaps most importantly, the authors highlight the data limitations inherent in analyzing charters schools, noting that the city’s charters are “not required to report revenue or expense information in their audited financial reports in a consistent manner” and that “different schools use different categories for revenues and expenses.”23 The report notes that because of the differences in reporting, “revenue and expense categories for comparison were based on assumptions about the appropriate categorical designation.”24
Philadelphia
In Philadelphia, the rapid increase in charter schools and charter enrollment compounded with a lack of adequate oversight resulted in a situation that was “… extremely vulnerable to fraud, waste and abuse ….”25 In an April 2010 report released by the City’s Office of the Controller, it notes that the Philadelphia’s School District’s Charter School Office (CSO) was “… only providing minimal oversight of charter schools except during the time leading up to the charter renewal”26 and that the $290,000,000 a year paid by the SDP to charter schools was “… at risk.”27
The report goes on to give specific examples, such as more than 80 percent of charter school files being “… incomplete, missing items such as the charter agreement itself, articles of incorporation or proof of insurance.”28 It also highlights one charter administrator who was being paid in “… excess of $500,000 per year in salary alone, was running three separate charter schools, a state chartered cyber school, a private non-profit school, and three separate for-profit entities with the boards, employees, and funds intermingled.”29
It is important to not misread Philadelphia as indictment of the charter model or the city’s many successful charter schools, but rather as a cautionary tale of what happens when system growth exceeds administrative capacity and the ability of staff to monitor and regulate.
In October 2014, the Office of the Controller released the report “The Impact of Charter Schools on the School District of Philadelphia.” The report noted that the “… rapid growth of Charter Schools since 2000 has placed tremendous strain on the District’s financial resources.” The report notes that the District’s Charter School enrollment increased from 3,225 students in 1999 to 61,740 students in 2013, an increase from 2 percent to 30 percent of total public school enrollment.30
The report further notes that “if Philadelphia’s Charter Schools were their own district, they would be Pennsylvania’s second largest by quite a margin”31 and that as “charter school enrollments have grown, and as the financial fortunes of the SDP have fallen, Philadelphia’s Charter Schools have, in the aggregate, consistently run a surplus. In 2013, while the SDP faced a deficit in the $70 million range, the Charter Schools posted an aggregate positive fund balance of $117 million.”32
And what of the oversight for those 62,000 students? The report notes that as of 2014 “a sector that educates one-third of Philadelphia’s students was overseen by fewer than 6 staff in the SDP’s Charter School Office with an annual budget of less than $1 million.”33
Milwaukee
In contrast to Philadelphia’s growing pains, the city of Milwaukee is often held up as a model of the school choice movement.
Wisconsin’s nonpartisan Public Policy Forum released two reports examining the city’s public school system. The December 2014 report, entitled “The K-12 School System in Milwaukee: How has it changed and how does it measure up to peers?” describes the city as the “epicenter for experimentation and innovation in K-12 education.”34
Milwaukee has a robust and somewhat complex school choice program, with multiple charter authorizers, including the local school district, and a private school voucher program.
In Milwaukee, the marketplace is competitive.
Focusing on the student movement and school growth from 2003-2004 to 2013-2014, the report states that “…the rate and degree of system change have been substantial – so substantial, in fact, that we ask whether the astonishing number of school closings, openings, and restructurings – as well as the accompanying high degree of student mobility – has served students well.”35
Analyzing data from the Wisconsin Department of Public Instruction (DPI), the National Center for Education Statistics (NCES), and the Census Bureau, the Forum found “substantial” enrollment growth in the city’s private and charter schools, with charter enrollment “… increasing by 6,616 (53%) to more than 19,000 students.”36
Yet, in the same time period, overall student enrollment, in the city’s private, charter, and traditional public schools declined by seven percent, and at the same time the city experienced a contraction in the total number of schools, with “90 fewer schools in the 2013-14 school year than 10 years before.”37
According to the report, some of that variance is due to student transfers between traditional public, charter, and private schools that participate in the city’s voucher program, but that the number of closings in the decade examined “went far beyond what might have been expected from enrollment shifts,” noting that “173 schools – nearly half of the 383 Milwaukee schools open in 2003-04 – closed or restructured in the following decade, while 81 new schools were established.”38
The report notes that “Milwaukee schools operate in a highly competitive environment and many students move from one school to another each year” resulting in closures in tuition-dependent private schools.39
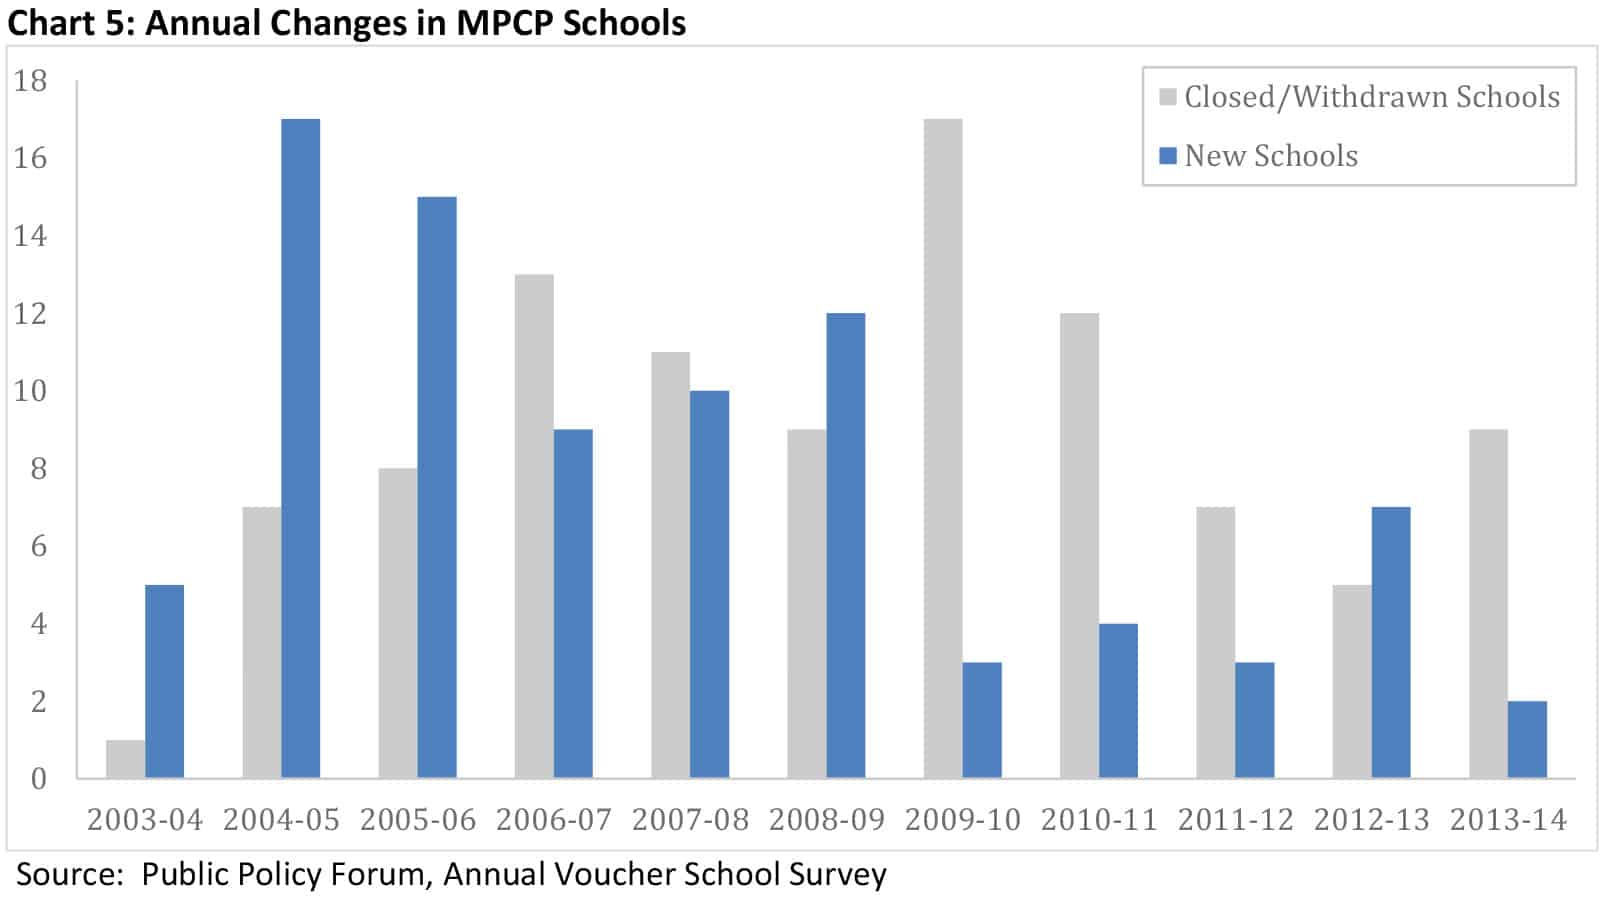
The city’s charter schools have experienced a similarly drastic flux between school openings and closings.
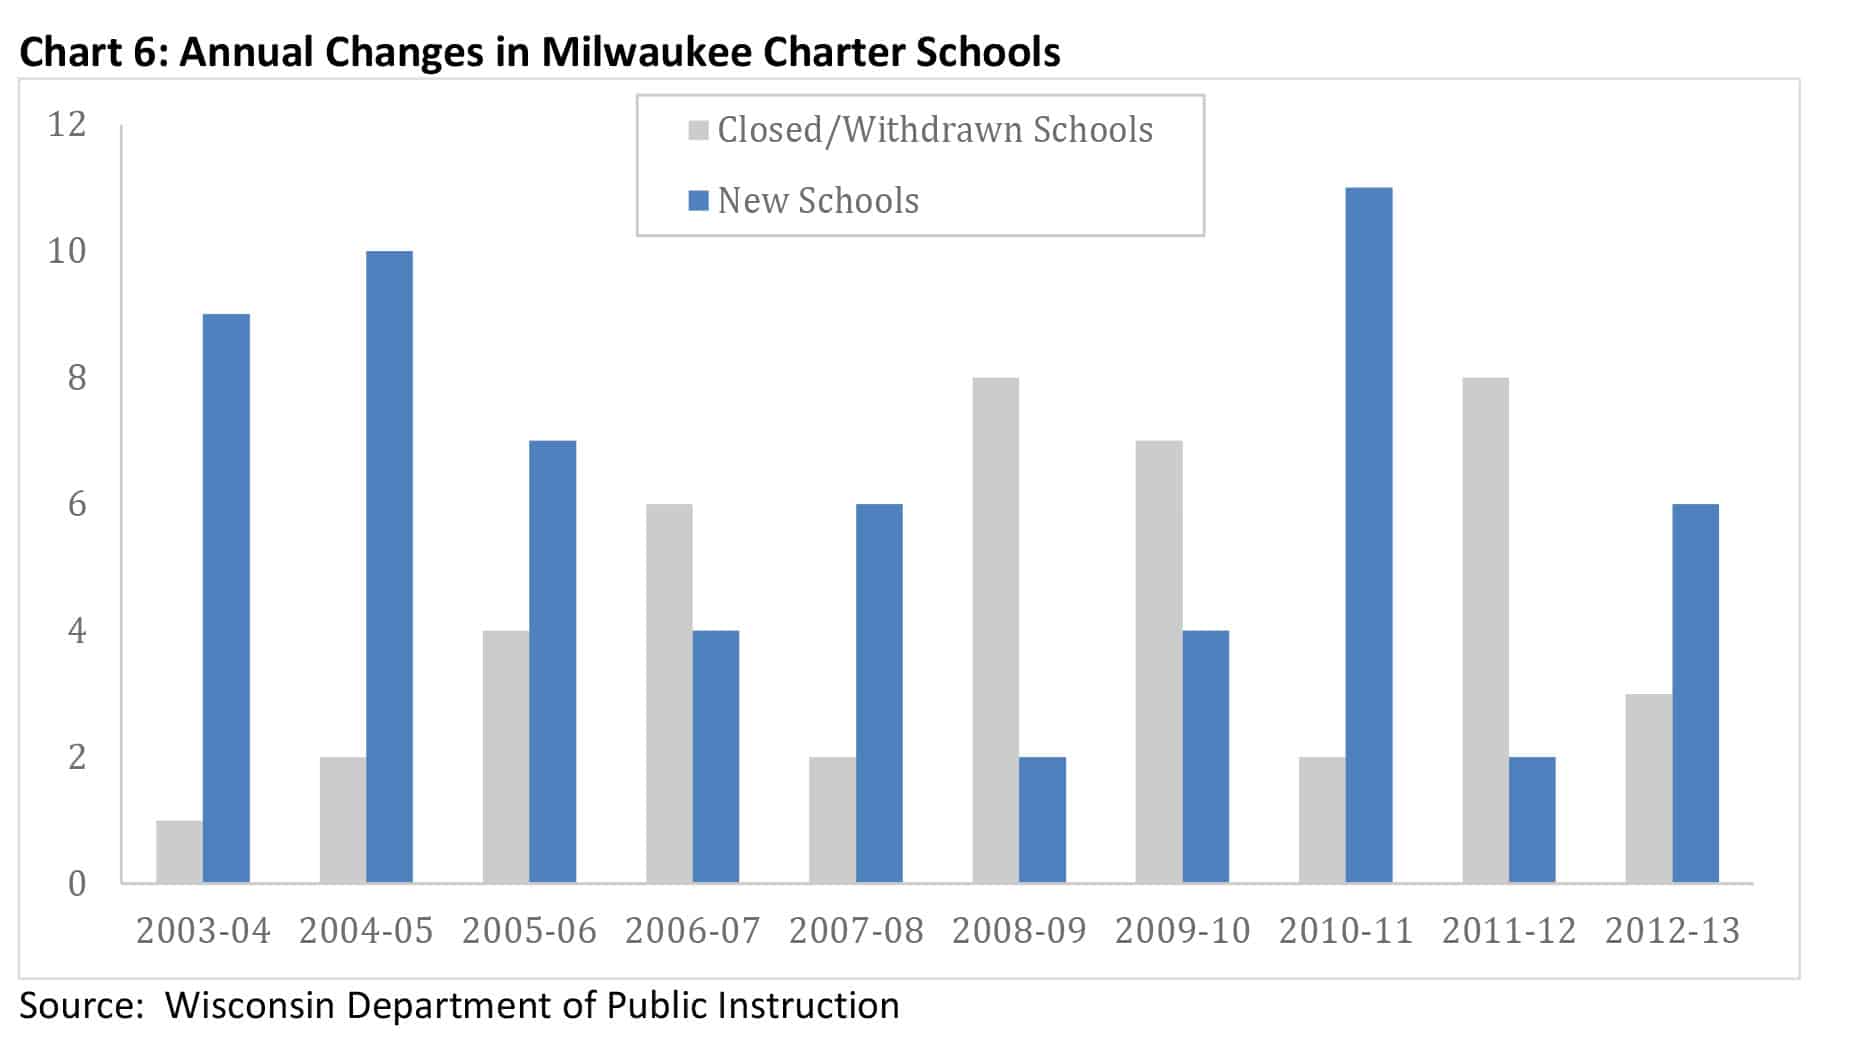
The reason for the charter closings vary, including, “poor academic performance, low enrollment, and financial difficulty” with nine closures being without a reported reason. The authors note that,”… the long list of charter school closures may cause some to question whether charter schools have been established too quickly, without sufficient planning and preparation, and thus have been more susceptible to failure.”40
Ultimately, “additional research is needed to explore such questions.”41 It should also be noted that the the traditional public schools in Milwaukee also experienced a significant restructuring, due to an initiative to “…establish more neighborhood schools, shift to smaller high schools, and expand the number of K-8 schools instead of relying on a K-5 and middle school combination.”42
New York
In 2013, the Center for Governmental Research (CGR) examined the state’s system of charter schools. The Center notes that there are multiple charter school authorizers in the state, including local boards of education and three separate state-level agents or entities.43 The report cites research showing that charter success is often related to the level of authority and oversight of its particularly authorizing agency, noting that “A strict authorizer—one that holds schools accountable and closes poor performers—will achieve better outcomes for all the schools under its purview.”44
Charter schools in New York are funded by a redistribution from the local school district, an amount that equals the “average operating cost per student for the student’s district of residence.” The report notes that the source of the funding does not affect the distribution, thus federal and state dollars are redistributed along with local funding and that local districts “receive no transitional aid as charter school enrollment increases.”45
Also, according to the CGR report, “New York districts are also obligated to provide the same services to charter schools they have always been required to provide to nonpublic schools, e.g. transportation, textbooks, some special education services, etc.”46
The report cites the experience of the Rochester Charter Schools Committee as a case study of the charter school movement in the state. The report notes that enrollment has remained steady in the Rochester charter schools, increasing to 2,700 in 2013-2014 from 2,400 in 2004-2005.47 In 2012-2013, charter school tuition in the Rochester City School District was at $32 million, accounting for four percent of the district’s total budget for that year.48
Regarding student achievement in the state, the report cites several studies that examined the level of educational performance in the state’s charters. The report notes that “… many charter schools, including many in Rochester, outperform traditional public schools is clear. The challenge lies in determining whether the schools are competing fairly or if they are ‘creaming,’ i.e. attracting a better prepared and better supported student.”49
According to the report, as a rebuttal to the “creaming” accusation and its impact on student performance measures, supporters of the charter model frequently cite the high percentage of students in poverty enrolled in their schools. The authors note that poverty is inherently a tricky measure and that the role and influence of parents and families in charter selection is often overlooked when considering charter school performance. The report notes: “A charter school is always a choice—the ‘path of least resistance’ is nearly always a traditional public school. Thus the parents who select a charter for their children are likely different. These children are more likely to succeed because they’re being raised by parents who care more about education.”50
Citing several studies, the report notes the influence of parents in student success outcomes. One study included 93 percent of the state’s charter students, following students whose parents entered their children in a charter lottery. The study then followed both the children who won the lottery and subsequently enrolled in a charter and those who continued in a traditional public school. The study found that students in charters did significantly better than their traditional public school peers, but at the same time those students who entered a charter lottery but returned to a traditional public school also did better than the other students in traditional public schools. The report notes that the outcome, “… tells us that parental motivation really matters.”51
The CGR report also sites leadership as being a key factor in charter school success, noting that, “[e]vidence suggests that successful charter schools succeed when they attract exceptional management and exceptional teachers, which is the lesson of effective schools across the board.”52
The report concludes with two questions:53
Does leaving students with more motivated parents in the classrooms of traditional schools improve the outcome for all or simply make success unattainable for that group of students?
And is it possible to create the kind of performance culture that pervades outstanding charters … in schools where power is broadly (and unproductively) diffused among the administrators, union leaders, teachers and parents?
New Orleans
In some ways, New Orleans is both a shining example and unprecedented outlier of the school choice movement. At 93 percent enrollment, it has the highest percentage of charter students in the nation, but the city’s revamped school system was created after a catastrophic natural disaster with a massive amount of federal and state spending and support.
A 2010 policy brief by the Public Affairs Research Council of Louisiana (PAR) points out that “almost three months after Katrina struck, the state took control of more than 100 of the lowest performing schools in Orleans Parish and transferred them to the RSD.”54 The RSD is the Recovery School District, created in 2003 to take over failing schools, but which in 2005 was suddenly “faced with the task of rebuilding a school system from scratch.”55
Pre-Katrina, the New Orleans public school system “ranked second to last for student performance in Louisiana, which in turn ranked second to last in the nation”56 and “nearly two-thirds of the public schools in the city were deemed academically unacceptable.” 57
Post-Katrina, the RSD turned to the charter model to quickly revive the city’s schools. The Council’s report notes that, “the early results of this shift in public education delivery show promise as evidenced by increasing test scores, but the sustainability of this extensive network of charter schools remains a question.”58
The report identified a category of five best practices in the city’s charter schools, practices that could be replicated in other districts for successful schools:59
Establishing a learning environment
Best practices: clearly defined academic expectations, clearly defined behavioral expectations, a rewards or incentive system to encourage good conduct, unity- building events, parental involvement initiatives, calm and encouraging atmosphere
Data-driven instruction
Best practices: clearly defined assessment structures, mandatory tracking and analysis of data generated from assessments, intervention plans
Student enrichment
Best practices: extended school days, extended school years, Saturday programs, summer programs, non-academic activities, field trips
Teacher support and development
Best practices: Informal and formal observations of classrooms, administrative and peer feedback, regularly scheduled planning periods, regularly scheduled department/grade level meetings, regularly scheduled faculty meetings, professional development
Policy-focused governing boards
Best practices: formal process for selecting new board members, diversity of skills among board members, clearly defined process for evaluating school leader, succession planning, formal board training
However, according to the report, “these practices tend to be exchanged primarily among those in the charter school community… ” making it “… difficult to engage in a public dialogue about which practices are working well and which lend themselves to replication in traditional public schools.”60
A joint analysis of the governance structure of the New Orleans public school system by The Bureau of Governmental Research (BGR) and Tulane University’s Cowen Institute for Public Education Initiatives examined the complex structure of the district’s funding and administrative functions following the RSD take over. The report notes that at the time of the transition, RSD took control of 107 city schools–many of which were converted to charters– and the Orleans Parish School Board (OPSB) retained oversight of 17 schools.61
At the time of the report, New Orleans was faced with making sense of what was essentially two school districts in which 60 percent of students were enrolled in charters that “… operate independently of the districts in the 2008-2009 school year.”62 Today, more than 90 percent of city’s students are enrolled in a charter school.
So it is not an understatement when the authors state simply, “This is extraordinary.”63
The report notes that “… given that the explosion of charter schools occurred in a very short time frame under extreme conditions. There was inadequate time to anticipate the issues presented by the radically transformed system, much less to develop an appropriate governance framework for dealing with them.” 64
The authors then compare the issues facing New Orleans similar to those facing our young country after the Revolutionary War: “[H]ow to transform a loose federation of entities into a well functioning whole.” 65
The BGR and Tulane report goes on to layout in detail possible options for an overhaul of New Orleans’ governance of its public schools. However, the authors are quick to note that a return to a pre-Katrina system of oversight and management is not an option.
“New Orleans has had a great deal of experience with a wholly elected School Board controlling all aspects of governance. It failed to perform well. Calling on such a body to resume the same role in a drastically changed system would be, prima facie, ill-advised.”66
In another 2013 report, BGR examined the financial standing of the New Orleans public school system, specifically the district’s General Fund Balance, which at the time of the report was at a remarkable $46.4 million in surplus.67 As with the complex issue of governance dealt with in the 2010 report, BGR examined the complicated role of the Orleans Parish School Board (OPSB) as financial manager for schools directly under its supervision as well as those schools managed by the RSD.
The report is quick to praise OPSB for its improved financial stewardship, a turnaround from a pre-Katrina state of negative balances 68, and “financial mismanagement and corruption”69 to a current state of clean audits and solid bond ratings.70
At issue in the report is how the OPSB could best manage a significant General Fund Balance, a result of the massive influx of federal and state funds into the district in an attempt to rebuild the educational infrastructure of the city post-Katrina.71 The report also notes that in addition to the large General Fund Balance, OPSB is also charged with providing financial oversight to RSD-managed schools. Despite the fact that OPSB only directly manages six schools, it is:
“… responsible for managing the finances of the public school system as a whole. It alone exercises the taxing and bonding authority for public schools in New Orleans. It alone determines how certain revenue streams and resources are spent.”72
The graph below visualizes how this complex structure of management could be problematic for a system where the majority of schools are not directly managed by the body taxed with providing their financial oversight.

The BGR report makes several detailed suggestions for improving upon the current finical management approach, including policies to better regulate use of the General Fund surplus and increase transparency and communications with schools directly under RSD management.73
In October of this year, the Orleans Parish School Board enacted new policy procedures regarding the oversight and management of the General Fund. The Board adopted the BGR recommendation put forth in the 2013 report to reserve the fund balance for emergency situations. Any withdraw from the Fund will need a supermajority to pass and any funds used are required to be replenished from future tax revenue.
BGR expects to release an updated report dealing with governance matters early in 2016.
Utah
A report from the Utah Foundation examined financial challenges facing the state’s charter schools after that state lifted its charter school cap in 2005.74 The Foundation noted the discrepancy in funding between the state’s traditional public schools and charter schools, noting that in 2004 charter schools received $801 per pupil less than district schools.75 The report notes that for FY 2004, charters received $4,955 per pupil in funding, compared to $5, 756 for traditional public schools.76
Citing the three traditional funding streams for the state’s charters — local, state, and federal — the report notes that charters are more dependent on federal and state dollars than their public school counterparts, with federal support accounting for 17 percent of charter revenue compared to only seven percent for traditional public schools, and with state support of roughly 73 and 58 percent, respectively.77 The reverse is true for local funding, with traditional public schools receiving 34 percent of their funding from local tax revenue and charters only receiving 10 percent.78
As with other charter schools across the country, the danger is an over dependency on federal funding. The report notes that the competitive government grants typically received by charters are not guaranteed year to year.79
The report systematically breaks down the per-pupil discrepancy in funding as follows:
- $226 per-pupil difference in federal Title 1 funding80
- $115 per-pupil difference in transportation funding81
- $100 per-pupil difference in technology funding82
- $552 per pupil difference due to shortfalls in the state’s “formula for replacing local property tax revenues83
The total discrepancy calculated totals more than the $801 cited earlier in the report. The authors note that, among other things, the discrepancy between the two amounts is due to the larger share of donations and contributions per-pupil for charters as opposed to traditional public schools.84 The report estimates Utah’s charters received $334 per pupil in donations for FY 2004, compared to only a “tiny amount” for traditional public schools.85
However, the report notes that at the time of its writing, the per-pupil discrepancy in the state had been cut by almost half due to a five-year federal grant awarded for FY2005.86
The report suggests policy recommendations to pave the way for successful charter school expansion in the state, recommendations that address concerns in the charter school community, such as high facilities87 and administrative costs and management per school that traditional public schools can disperse across a district.88
The Foundation’s final policy recommendations include providing transportation funds to charters, increasing supplemental funds for charters that offset local property taxes that go to district schools, and creating a state matching grant to meet the five-year federal grant received in 2005, which would effectively equalize per-pupil spending between the state’s charters and traditional public schools.89
North Carolina
Compared to other states, North Carolina has taken a relatively guarded approach to the charter experiment, only as recently as 2011 lifting the cap on the number of charter schools in the state.
According to statistics from the Department of Public Instruction, the number of charter schools in the state increased from 100 in 2012 — the year after the legislature removed the state’s charter cap — to 148 in 2015, a 48 percent increase. In that same time span, total enrollment in the state’s charter schools increased from 44,793 in 2011 to 69,477 in 2015, an increase of 55 percent in total charter enrollment.
And while it is right to assume that most of that total growth has occurred in the state’s urban areas and metros — Wake and Charlotte-Mecklenburg alone accounted for nearly 22,000 charter students in 2015 — it does not mean that the state’s rural areas have not been affected by the growth of charters.
In fact, with the exception of Durham County Public Schools, the top-ten school districts with the highest percentage of students in charter schools are all in rural counties. The top two, Halifax and Person, have almost one-in-five students in a charter school, 19.7 and 19.1 percent respectively.
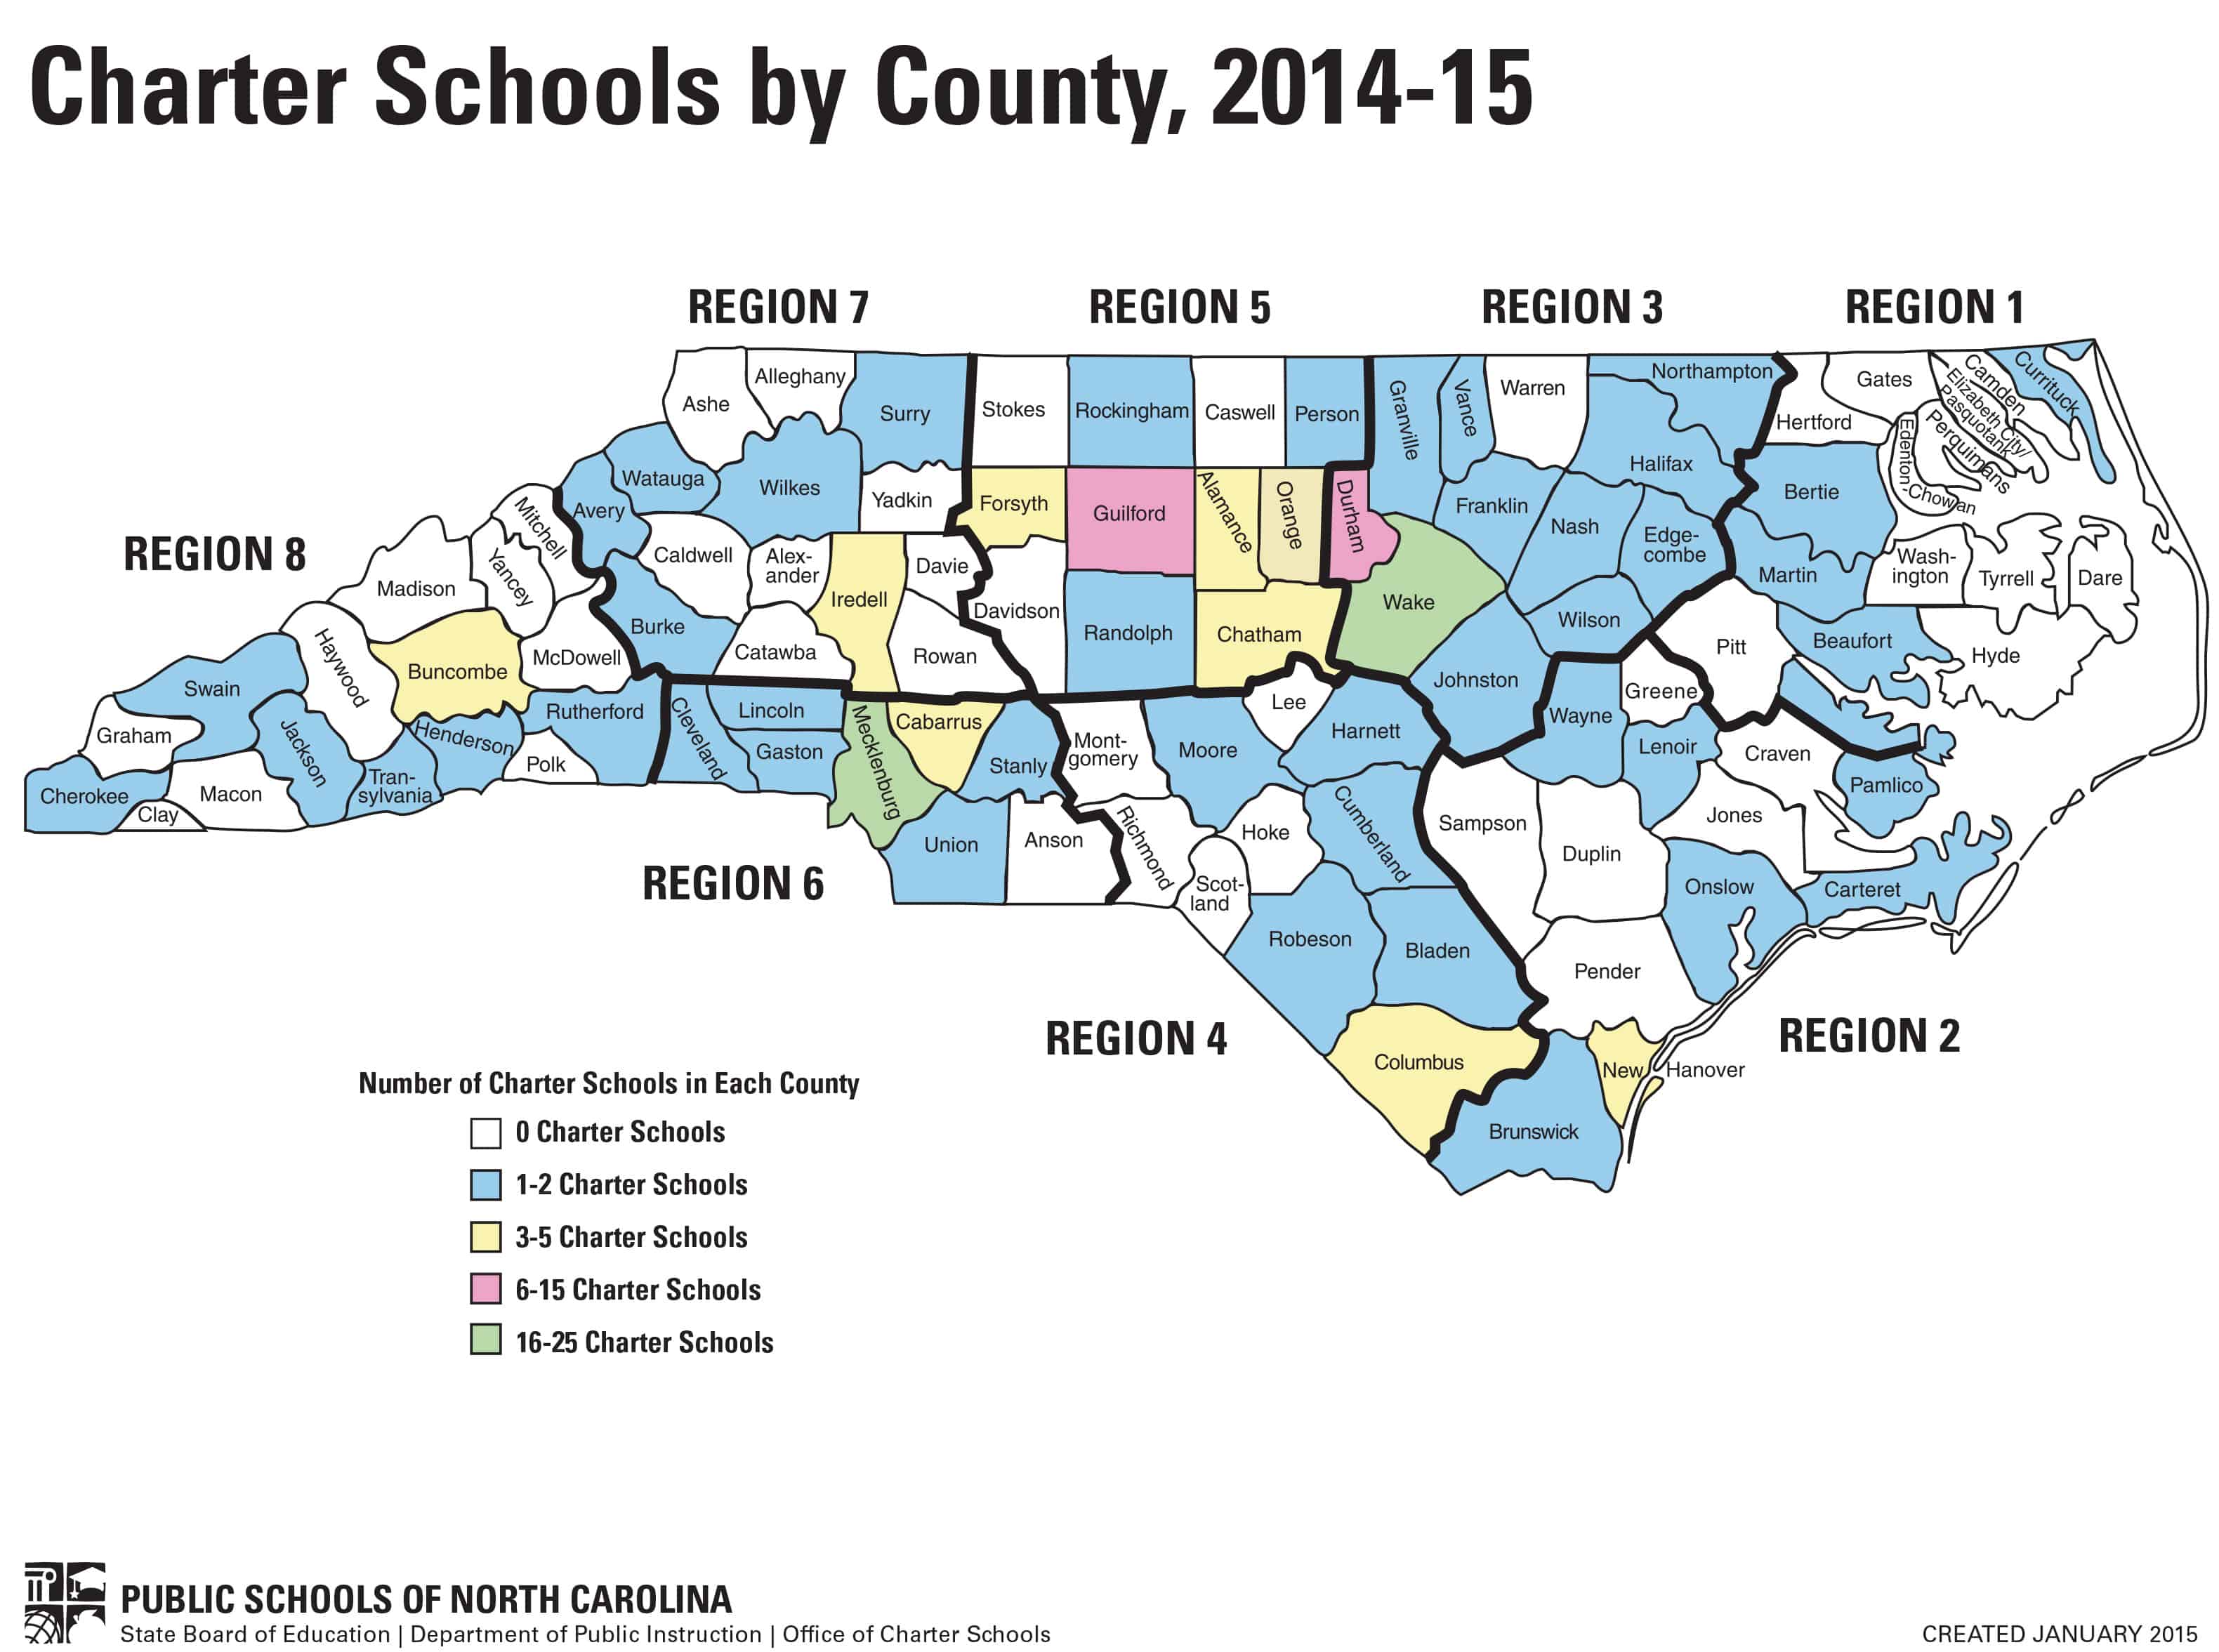
The map below from the Department of Public Instruction codes counties by the percent of public school students enrolled in a charter school.
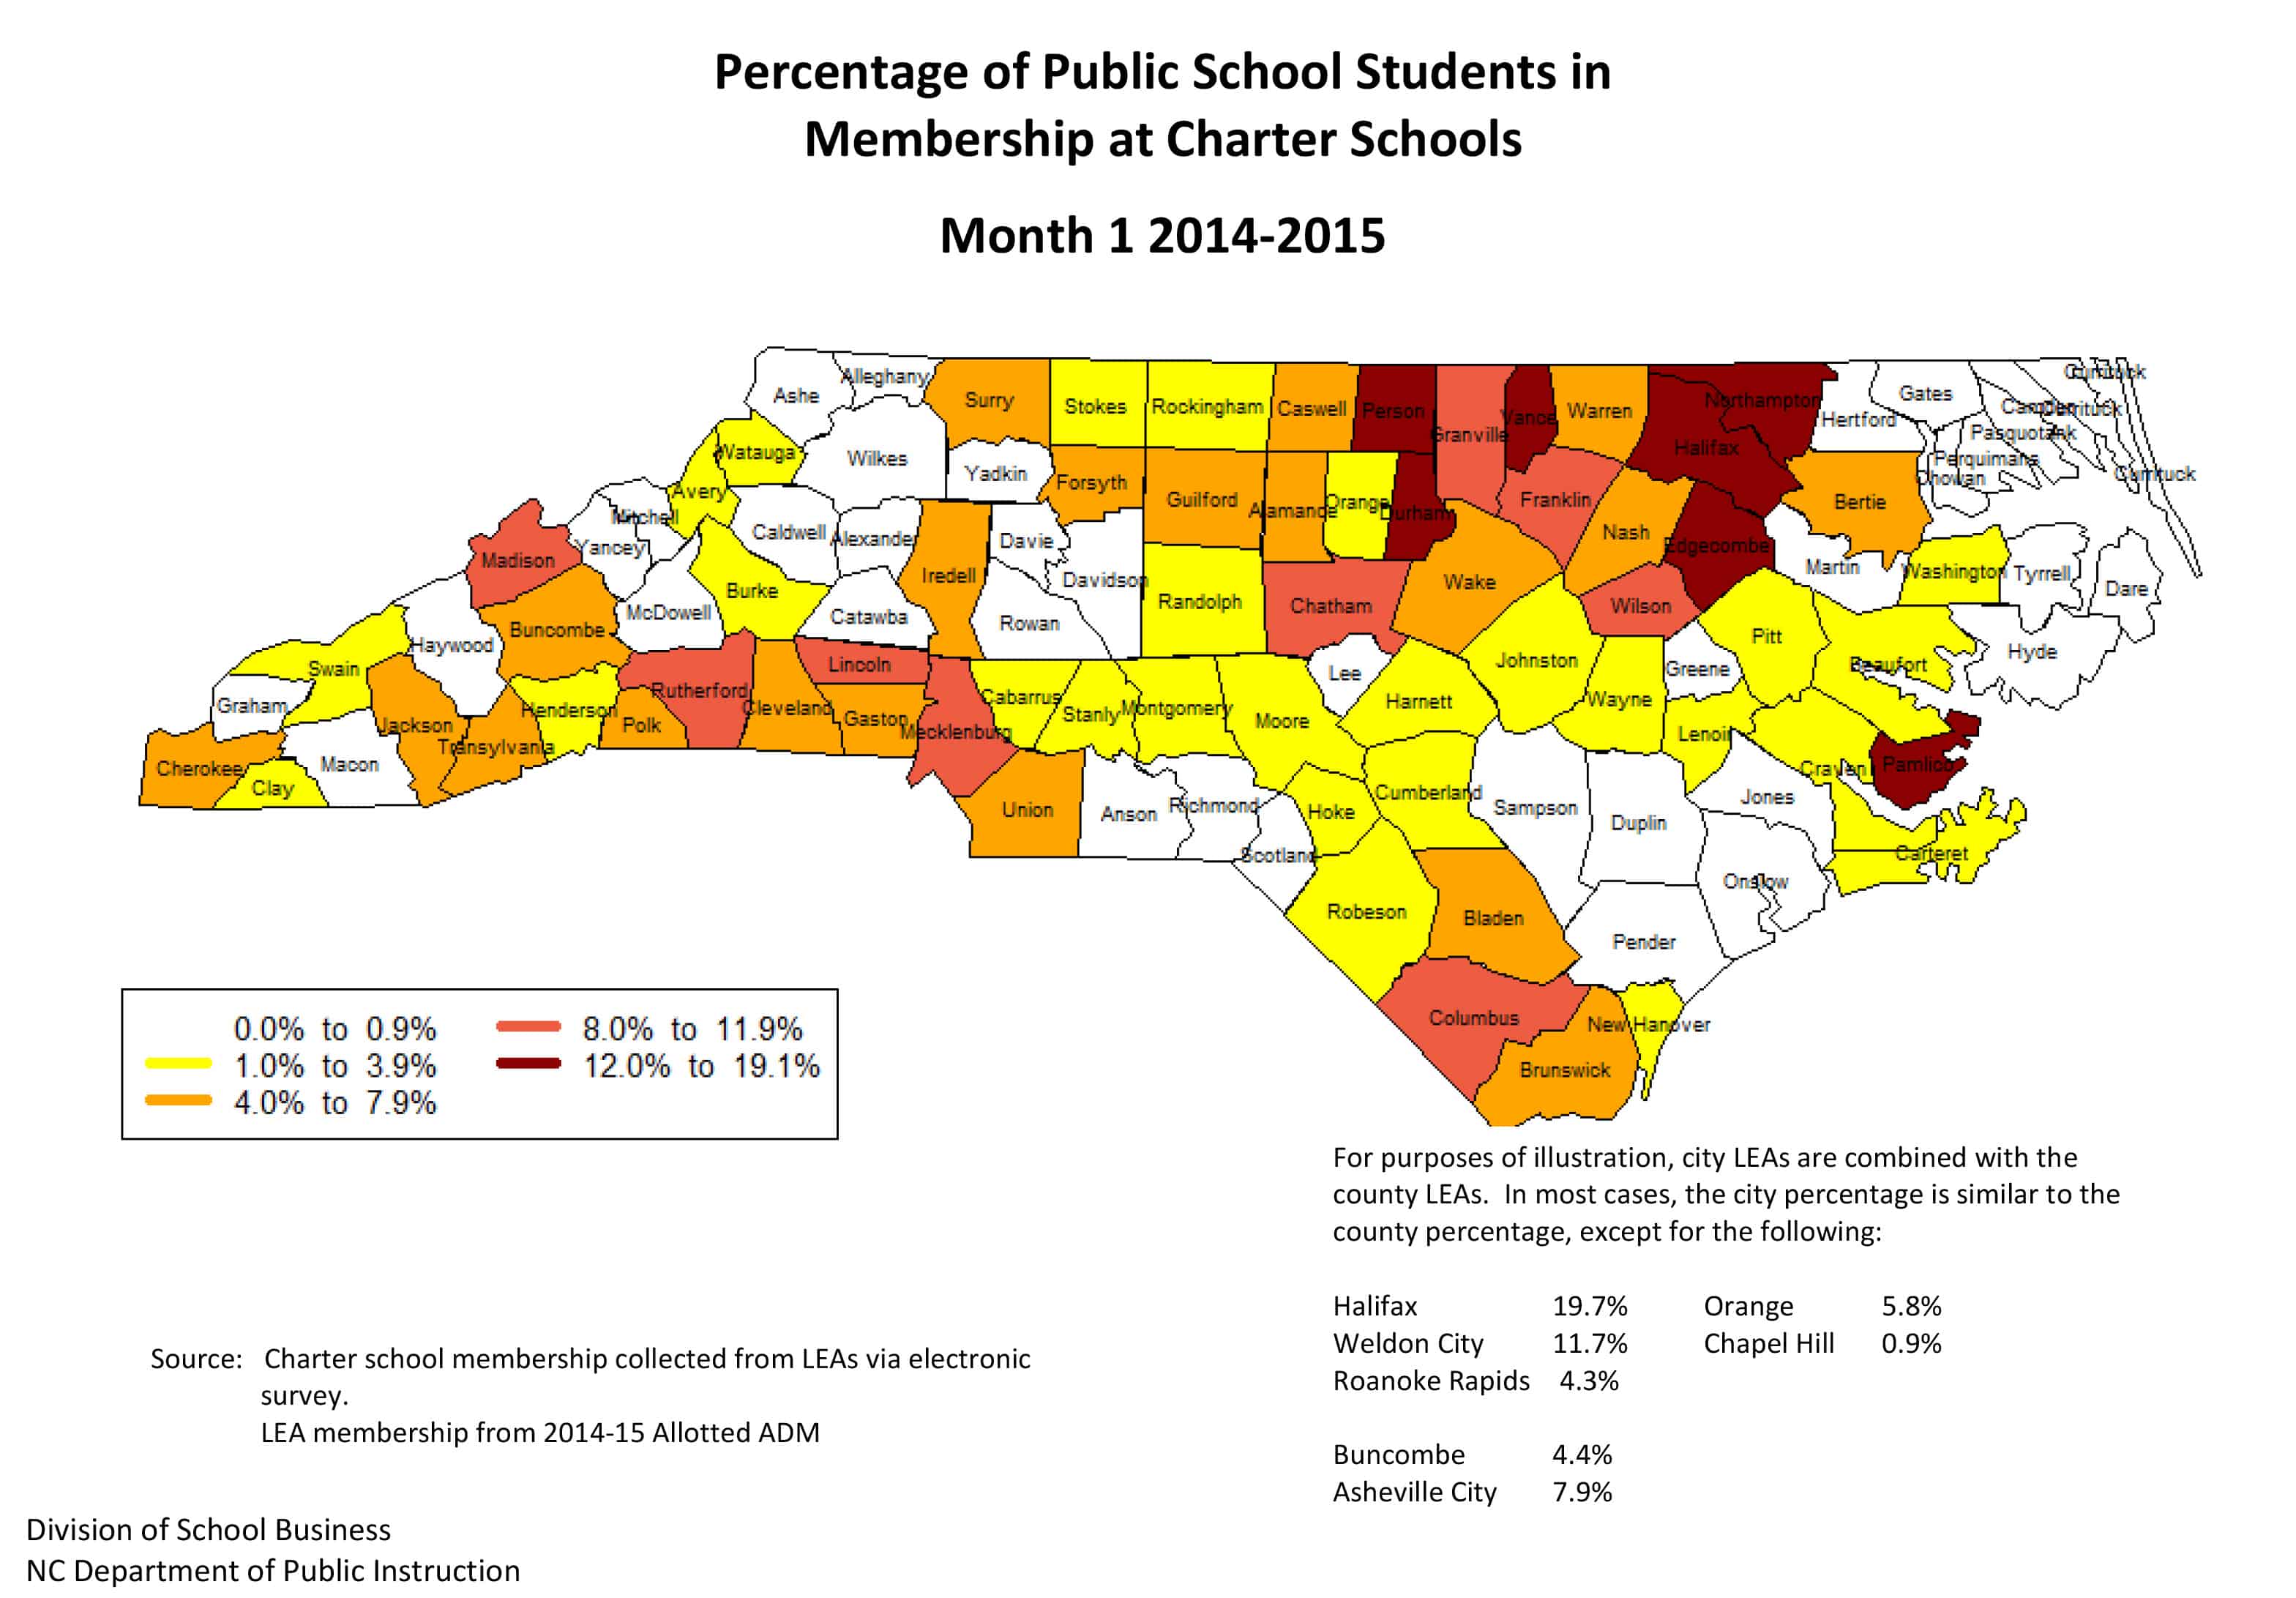
No doubt, 69,477 is a lot of students. Yet, overall, according to the Department of Public Instruction, charter enrollment only accounted for 4.6 percent of the average daily membership in the state, and, as EdNC has reported recently, the total number of home school students in the state now surpasses both the total number of charter school and private school students.
The North Carolina Center for Public Policy Research surveyed the state of charters schools in North Carolina at the five-year and 10-year marks. The Center cited the state’s original expectations of charters when it authorized their creation in 1996:90
- Improve student learning
- Increase learning opportunities for all students, with a special emphasis on at-risk or gifted students
- Encourage the use of different or innovative teaching methods
- Create new professional opportunities for teachers, including “opportunities to be responsible for the learning program at the school site”
- Provide expanded choice for parents and students within the school system
- Be accountable for student performance
One of the most anticipated returns on the charter investment was the gleaning of educational innovation from the charter experiment. Charters were expected to share with traditional public schools the successes and failures so those could either be replicated at scale or avoided at all costs.
However, according to its 2007 report, the Center found “little evidence” that innovations cultivated in charters had been transferred to traditional public schools in any meaningful way.91
The Center also noted that at the time, North Carolina’s charter school classrooms were more racially segregated than those of traditional public schools and typically had lower levels of academic performance and had experienced “problems with management and financial compliance.”92
In 2014, DPI announced it had received 40 charter applications for 2016. As North Carolina embarks on the next 20 years of charter growth, it is important for us as a state to take a breath and ask some hard questions about the first 20 years of our charter experiment.
- What are best practices from charters over the past two decades, and how do you scale them?
- What innovations in practice and management are needed and how do we incent them?
- Who is responsible for sharing information about best practices with public school administrators and educators, parents and policymakers? If charter principals were expected to serve that function, they have a school to run. If not them, then who?
- Have we done a good job of enabling charters and districts to work together? Has that been done elsewhere? If so, how do we replicate that across the state?
- How prepared are we as a state for the continued rise in percentages of rural students attending charters?
- As the number of charters continue to grow as a percentage of market share, what changes on the horizon might we be able to plan for and anticipate using the examples of places like Philadelphia, Milwaukee, and New Orleans as guides?
- We know big changes are ahead for charters—they are likely to be moved out of the Department of Public Instruction and changes in charter financing are probable—how will the state plan to monitor and study these shifts over the next year—and longer?
- Our state has never clearly identified our expectations for charter school performance. How good is good enough?
- What questions do you think we should be asking about North Carolina’s charter school experience? Who has a story to tell that has not been told?
Bibliography
Reports cited in the text (by order of appearance):
The Condition of Education 2015 (National Center for Education Statistics)
Estimated Number of Public Charter Schools & Students, 2014-2015 (National Alliance for Public Charter Schools)
Charter Schools in Perspective: A guide to research (Public Agenda)
A Financial Analysis of the Chicago Charter Schools: A Financial Indicator Analysis and Primer (The Civic Federation)
The Impact of Charter Schools on the Finances of Philadelphia (Office of the Controller, City of Philadelphia)
A Review of Charter School Oversight: A fraud vulnerability assessment (Office of the Controller, City of Philadelphia)
The K-12 School System in Milwaukee: How has it changed and how does it measure up to peers? (Public Policy Forum)
Charter Schools in Louisiana: What lessons do they have to offer the education community? (Public Affairs Research Council of Louisiana)
Managing Innovation: Models for Governing the System of Public Schools in New Orleans (The Bureau of Governmental Research and Tulane University’s Cowen Institute for Public Education Initiatives)
The Accidental Steward: The Orleans Parish School Board as a Resource Manager in the Reform Era (The Bureau of Governmental Research)
The Context for Assessing the Role of Charter Schools (Center for Governmental Research)
The Hidden Connection in City-Wide Reform: How charter schools can bring equity to public education (National Alliance for Public Charter Schools)
Challenges Facing Utah Charter Schools (The Utah Foundation)
The Charter School Experience in North Carolina (North Carolina Center for Public Policy Research)
Charter Schools Revisited: A decade after authorization, how goes the North Carolina experience? (North Carolina Center for Public Policy Research)
Background resources (alphabetical order):
The 2014 Education Choice and Competition Index: Summary and commentary (Brown Center on Education Policy at Brookings)
Assessing the Enrollment Trends and Financial Impacts of Charter Schools on Rural and Non-Rural School Districts in Pennsylvania (The Center for Rural Pennsylvania)
Charter School Oversight School District of Philadelphia (Office of the Controller, City of Philadelphia)
Comprehensive School Choice Policy: A Guide for Legislators (National Conference of State Legislatures)
Holding Public Charter School Authorizers Accountable: State experiences and policy recommendations (National Alliance for Public Charter Schools)
Measuring Diversity in Charter School Offerings (American Enterprise Institute)
Measuring Up to the Model: A ranking of state charter school laws (National Alliance for Public Charter Schools)
On the Road to Better Accountability: An analysis of state charter school policies (National Association of Charter School Authorizers)
The State of the Charter School Movement (Bellwether Education Partners)
Student Achievement (National Conference of State Legislatures)
Teaching in Charter Schools (National Conference of State Legislatures)
Online Sources
Education Commission of the States
NC Alliance for Public Charter Schools
National Center for Education Statistics
National Conference of State Legislatures
North Carolina Department of Public Instruction: Office of Charter Schools

Recommended reading