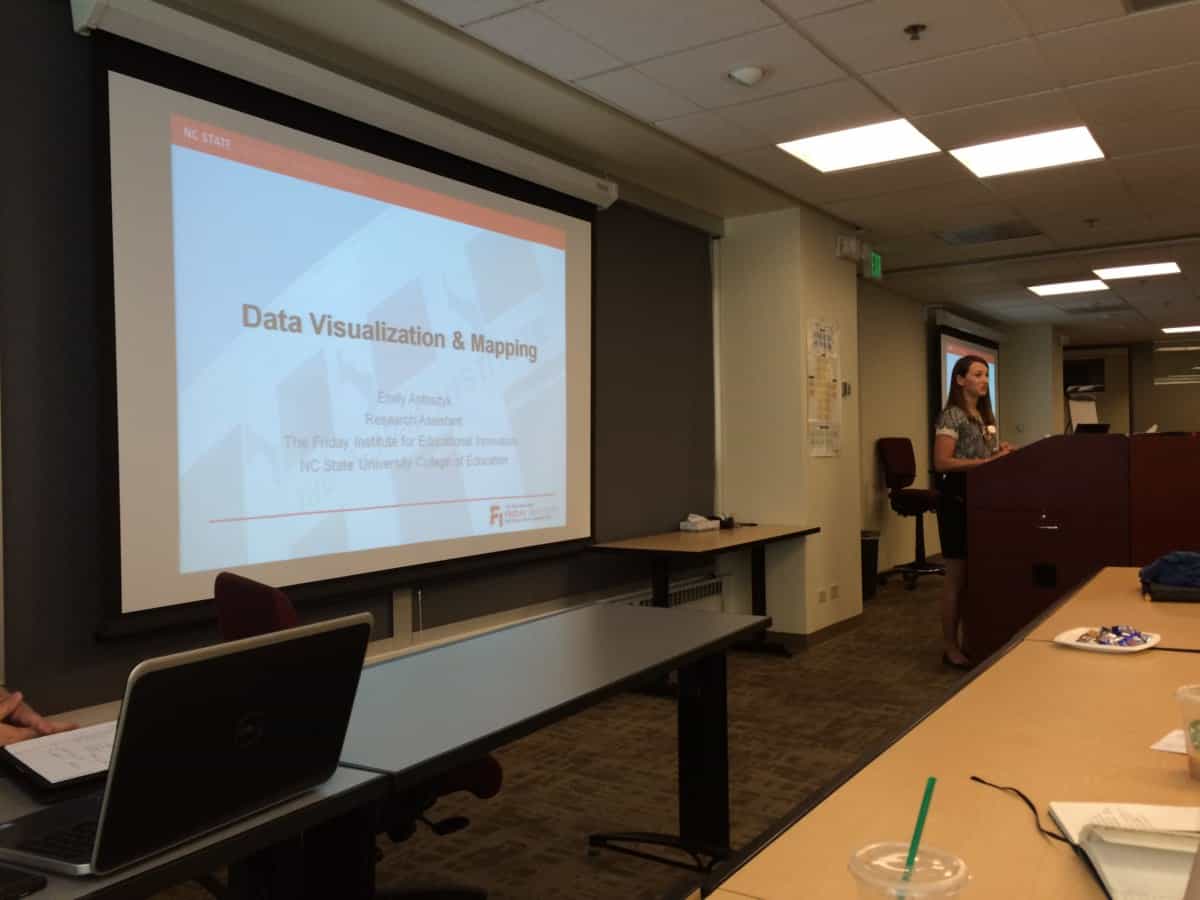


Yesterday Emily Antosyk of the Friday Institute for Educational Innovation released her latest map allowing comparison of the 2013-14 and 2014-15 school grades. For the first time, her map includes the grades for charter schools.
As a reminder, school grades in North Carolina were released for the first time last year, and the grades reflect 80 percent achievement and 20 percent growth. Antosyk’s map allows you to see how the school grades change if the state were using a 10-point grading scale instead of the 15-point scale currently in place.
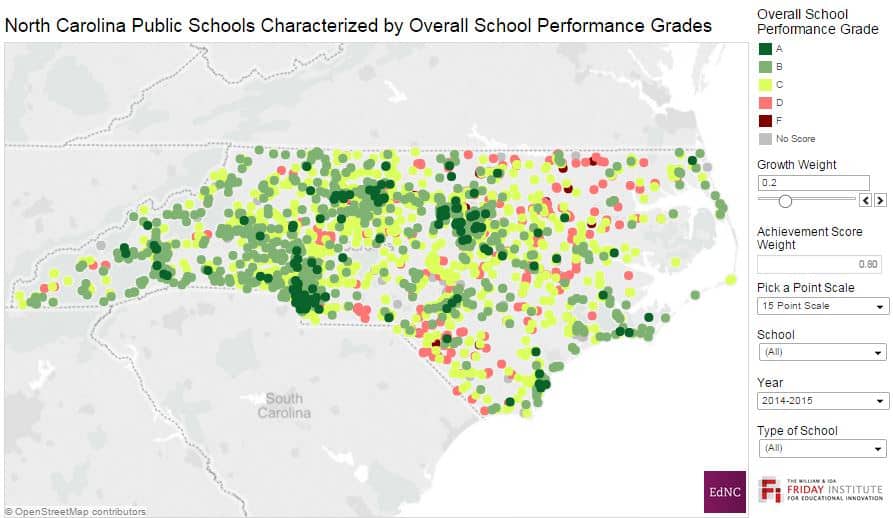
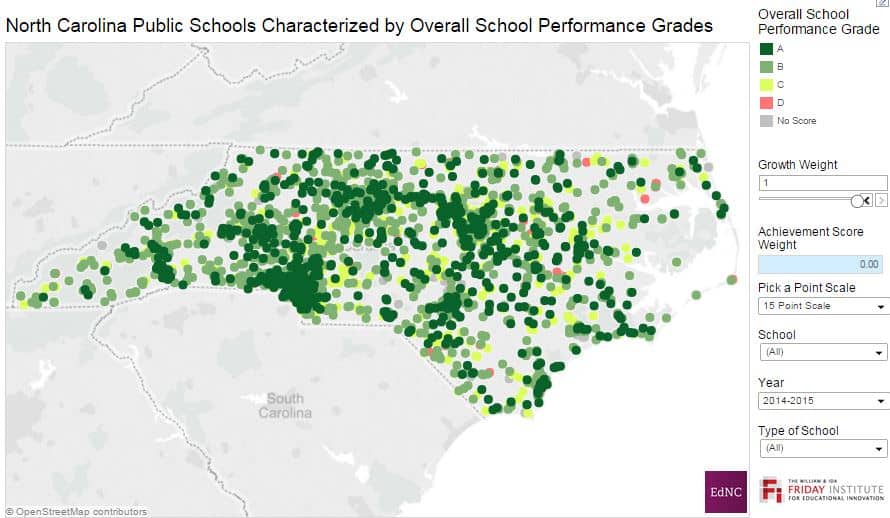
This is the map with 80 percent achievement/20 percent growth and the 15-point scale.
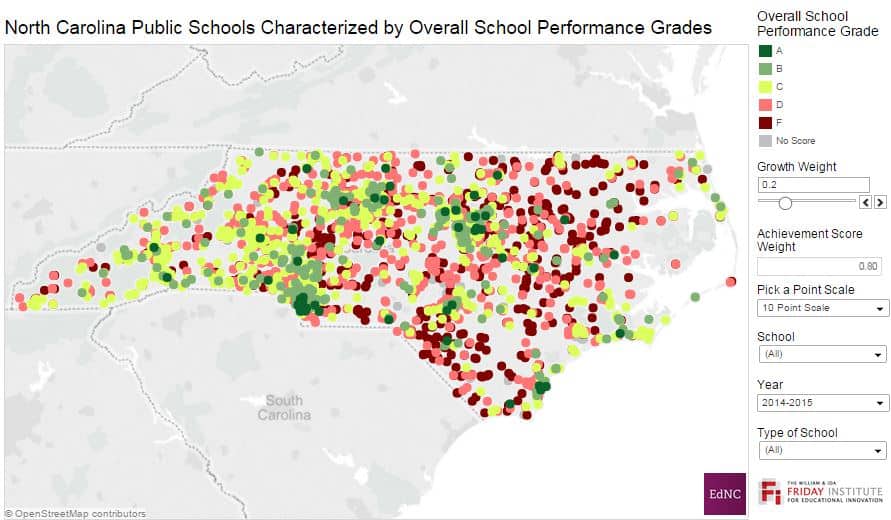
This is the same map with the 10-point scale.
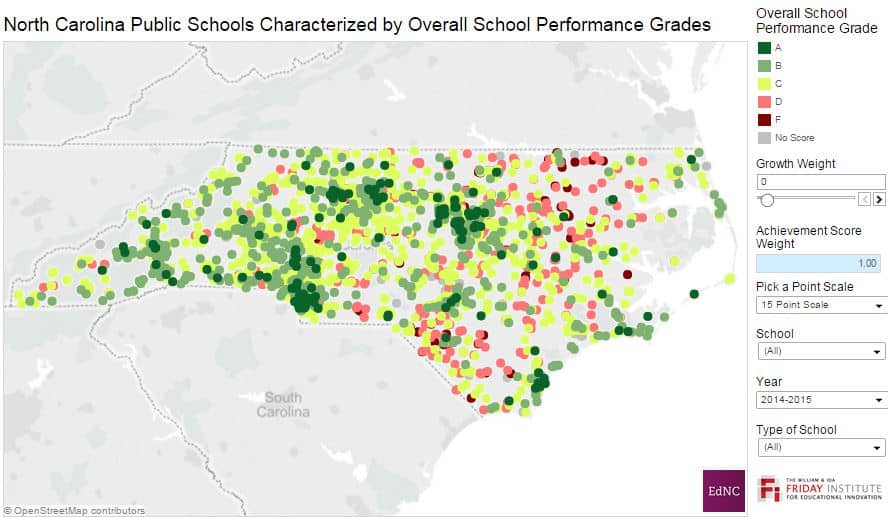
Antosyk’s map also allows YOU to choose the percentages based on your values to see how the grades change — statewide and for particular schools.
You could choose to have grades based on 100 percent achievement, 100 percent growth, flip it so that it is 20 percent achievement and 80 percent growth, or try out 50/50.
This is the map with 100 percent achievement.
This is the map with 100 percent growth.
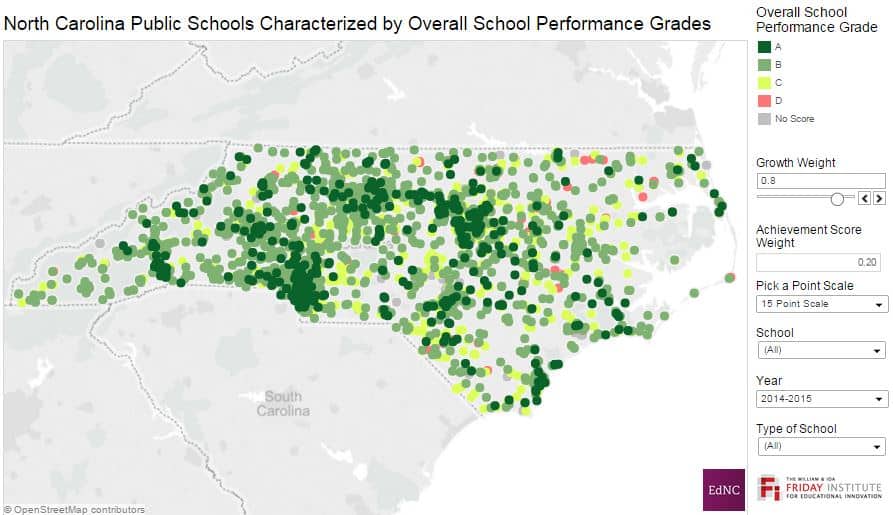
This is the map with 20 percent achievement and 80 percent growth.
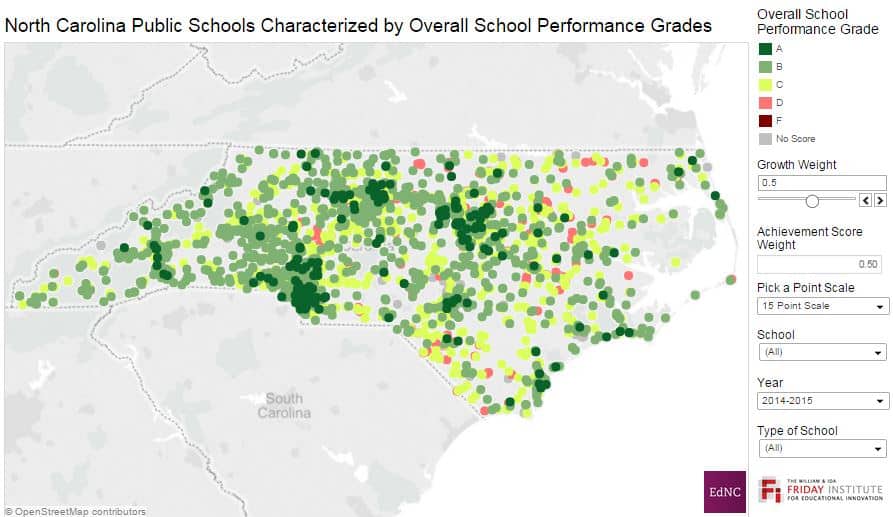
This is the map with 50 percent achievement and 50 percent growth.
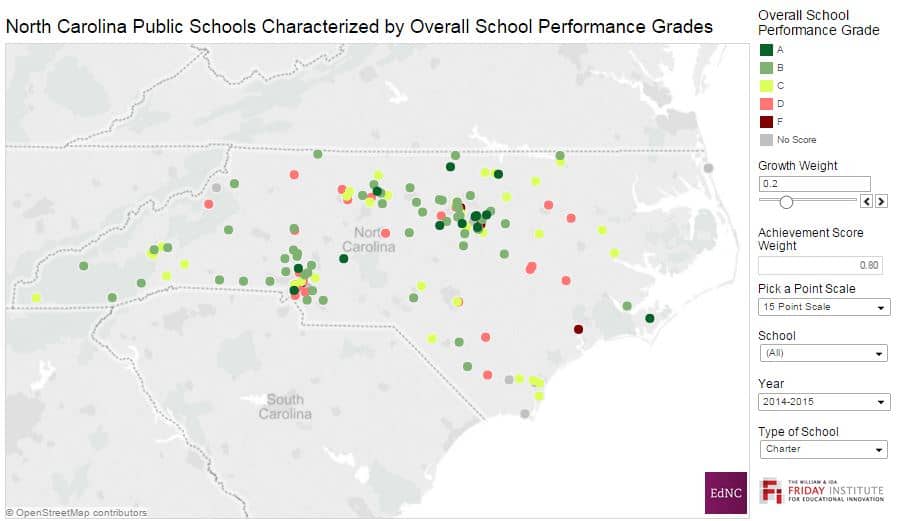
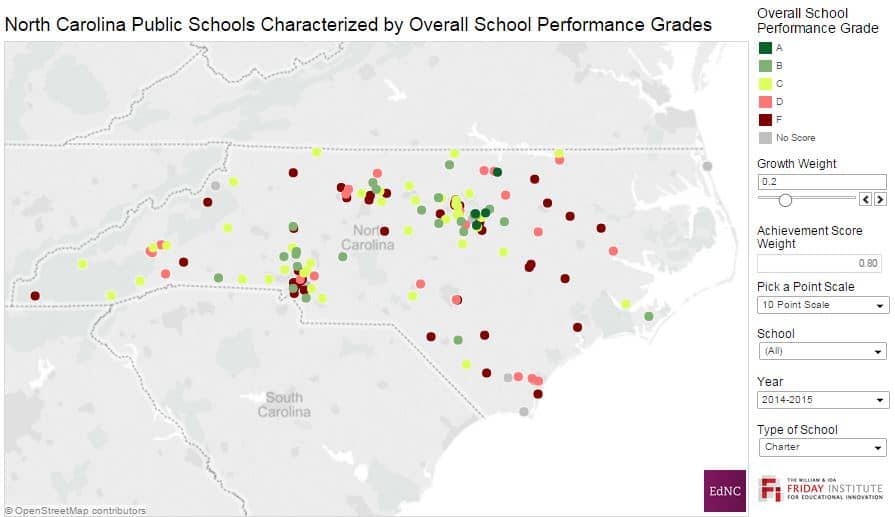
Here is the charter school map.
Here is the charter school map on a 10-point scale.
EdNC had this tool created to empower you — all of you — to take a deeper look at how these public policy choices — to have school grades, to use the existing 80/20 split, and the 15-point scale — impact your perception of our schools.
Share the maps you create by tweeting @EducationNC or leave them on our Facebook page.