Since the COVID-19 pandemic upended life as we knew it in March, North Carolina school districts have had to rethink how they deliver education. After transitioning online in the spring, districts could choose between a hybrid model with limited face-to-face instruction (plan B) and 100% virtual instruction (plan C) for the start of the 2020-21 school year this fall.
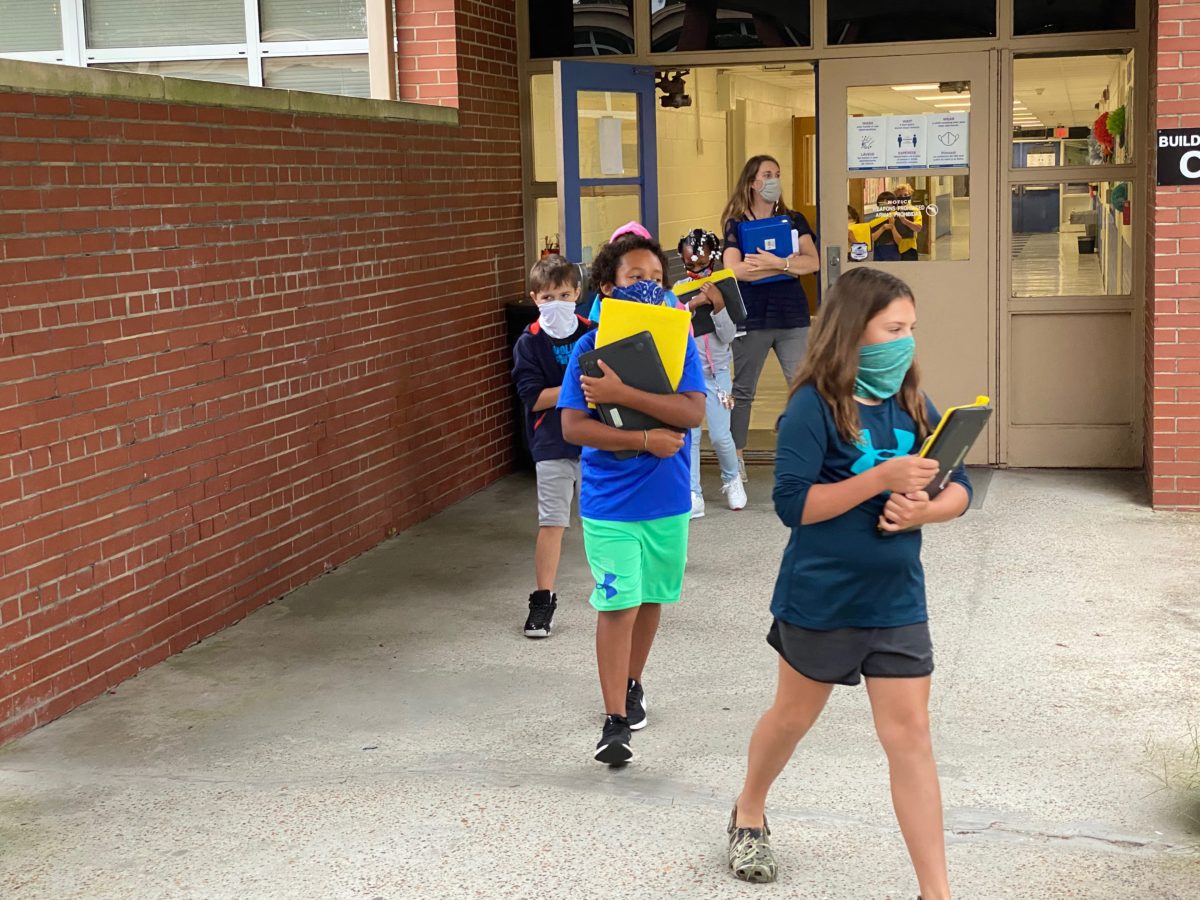
Many school districts, particularly the largest ones, made the decision to start the school year fully remote, while others opted for a hybrid approach. In mid-September, Gov. Roy Cooper announced schools could move to plan A, fully in-person instruction, for students in kindergarten through fifth grade starting Oct. 5. This week, after almost seven months, some K-5 students are returning to the classroom full-time.
With every district choosing its own instructional plan this fall, EdNC and Public Impact teamed up once again to track how schools are responding to the pandemic this school year. The NC Districts Fall 2020 Reopening Database documents some details of all 115 districts’ reopening plans. It is our hope this database can help guide school leaders and policymakers as plans continue to evolve throughout the year.
This database follows the original database that EdNC and Public Impact posted in April and updated in June, tracking shifts in instruction, student support, and operations last spring. For the fall, district administrators created plans based on the state’s “Lighting Our Way Forward” guidebook for reopening schools, which required districts to create plans for all three learning scenarios (plan A, B, and C).
Early analysis of these plans suggests improved but ongoing struggles with access to technology, gaps in support for special student groups like English language learners, and disparities in offerings between higher- and lower-wealth districts.
While every effort was made to provide accurate and complete information, district plans are changing rapidly, and some information proved difficult to track. Public Impact will conduct a second review of district plans in December to publish an updated database with EdNC in early 2021.
Early takeaways
To spot statewide trends and equity gaps, Public Impact’s data team analyzed the database results across district enrollment, race/ethnicity, rates of students receiving free or reduced-price lunch, county wealth, county internet access, and county computer access.
This early analysis highlighted five key takeaways:
- Instructional plan selected. Districts with higher concentrations of students of color were three times more likely to opt for fully remote learning (plan C) to start the school year than districts with the highest concentrations of white students (76% versus 24%). This finding is consistent with results from a national poll released by The Associated Press and Chalkbeat in early September. National family surveys also show that Black and Latinx parents disproportionately preferred to reopen schools remotely.
- Virtual academy option. Sixty-one percent of districts located in the wealthiest counties of the state offer a virtual academy, compared with 32% of districts located in the least wealthy counties. A virtual academy is a full-time, independent-learning option with its own teachers for which students may apply or opt in. It is distinct from a district’s all-remote option, in which students stay enrolled in their regular school with the same teacher or classes as they would have in person.
- Learning supports. The majority of districts — 58% — do not outline specific supports, recommendations, or requirements for social-emotional learning this school year. Only 11% require or recommend fall diagnostic assessments, and a mere 3% mention strategies to address learning loss from the spring.
- Supports for special populations. While about 65% of districts outline specific strategies to support students with disabilities this fall, only 34% mention specific supports for English language learners. And just 21% outline specific supports for students experiencing homelessness.
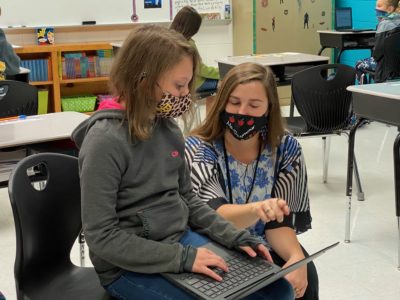
- Digital access. Access has improved since the spring, with 72% of districts having now acquired and distributed devices to all students, versus 43% in the spring. Similarly, more districts have distributed at-home hot spots to some or all students (45% versus 17%). However, internet connectivity remains a top barrier to equity statewide. Compared with the largest districts in the state, districts with the lowest enrollment are three times less likely to have information online about how families can access Wi-Fi during remote learning (37% versus 10%).
Two other statistics are noteworthy for students learning remotely: A third of districts did not have a clear attendance policy for remote learning days, and only 35% offered some form of delivery service for student meals.
See the data analysis tab in the database for more about each of these takeaways and the methods of analysis.
Developing the database
Using the state’s reopening guidebook and feedback from teachers and school and district leaders across the state, EdNC and Public Impact identified 14 indicators in five categories to track: instructional policies, learning supports, special populations, family resources, and digital access.
Public Impact researchers reviewed public documents and announcements on each district’s website and Facebook page to complete the database.
Researchers could not find information for every single indicator for most districts, but that does not necessarily signify district inaction; researchers only captured information communicated publicly online. If districts acted without communicating on their website or Facebook page or sent information directly to families via email or phone, the database would still say “no information.”
How to use the database
The database has several tabs. “About This NC Database” provides an overview of the project and methods.
“Definitions” describes each indicator in the database along with guidelines used during the coding process. This tab also includes short example descriptions of possible district actions.
“Data Summary” visualizes the distribution of indicator responses across all 115 districts. “Data Analysis” provides a few high-level takeaways from the database.
The “NC Districts Fall 2020 Reopening Database” tab shows the complete database, with each indicator at the top and every North Carolina school district down the left side.
To see an individual district’s plan in more detail, including our sources for each indicator, scroll to the district’s specific tab. Select the “All Sheets” button next to the plus sign on the bottom bar for easy navigation.
If you have direct knowledge of a school system’s digital learning plans or see information in our database that needs updating, please contact Molly Osborne at mosborne@ednc.org.


