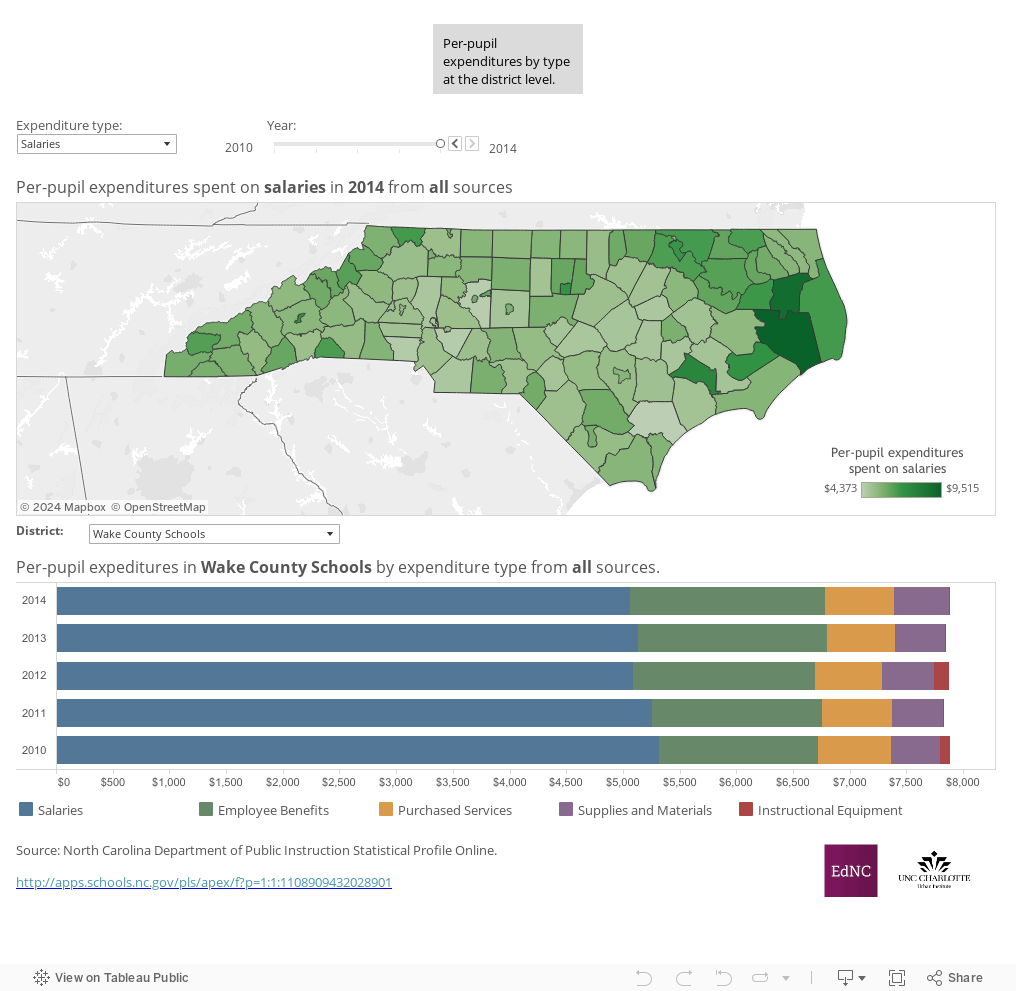
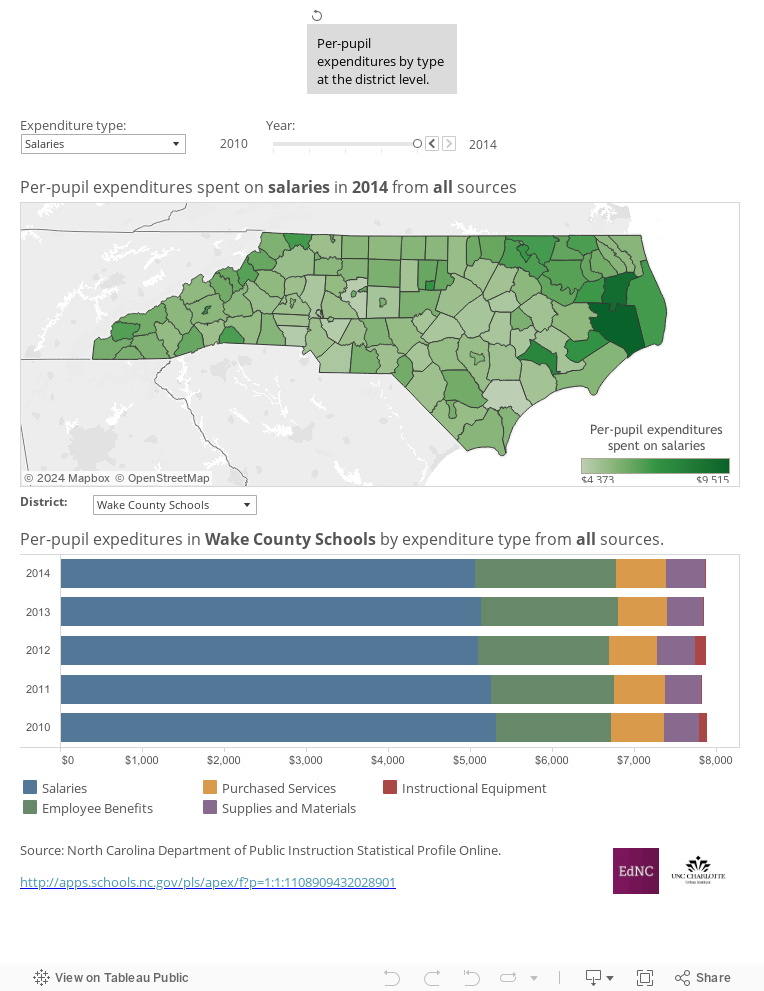
This week’s map takes a closer look at where per pupil expenditures are spent at the district level. The types of per pupil expenditures include employee benefits, instructional equipment, purchased services, salaries, and supplies and materials.
Hover over the map to view where per pupil expenditures are spent and the percent of per pupil expenditures spent in the selected category. Choose a type of expenditure displayed on the map by using the upper-right dropdown menu, or by clicking on a category in the graph. Use the graph to view the expenses that utilze per pupil expenditures for a school district over time. Select a district on the map or use the dropdown menu above the graph to view the district data.
A few observations about the numbers:
- Salaries accounted for over half of the per pupil expenditures for districts.
- Employee benefits was the second highest per pupil expenditure for most districts.
- Districts in the northeast region of the state, near the coast and in the mountains had higher per pupil expenditures spent on salaries.
- Per pupil expenditures spent on supplies and materials was highest in the northeast region of the state.
Note that per pupil expenditures are for total funding which includes federal, state and local sources. For per pupil expenditures by funding source, look at last week’s map for additional information.
About the author