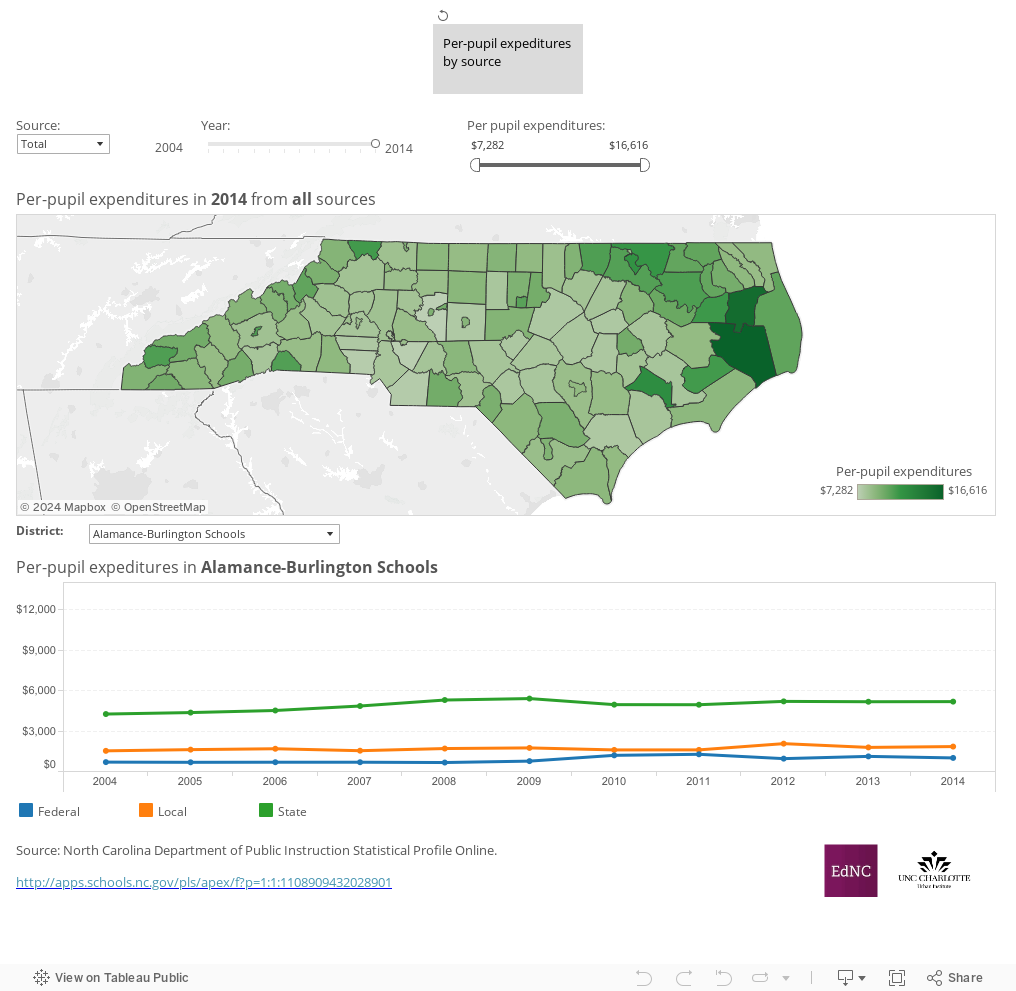
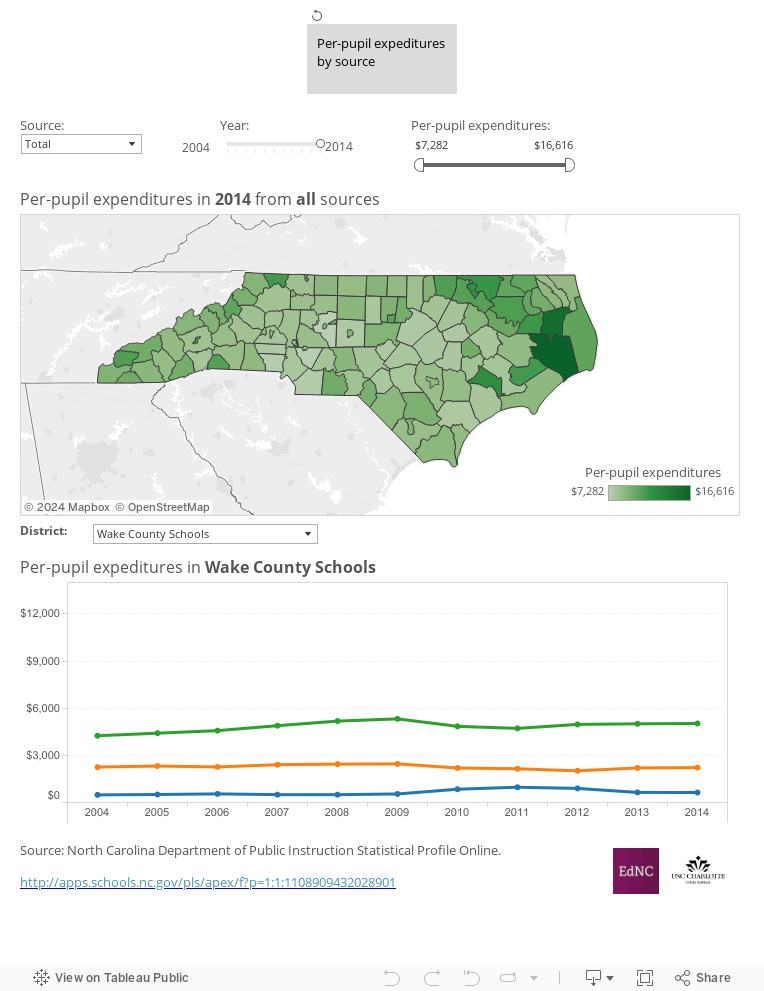
This week’s map looks at per pupil expenditures for school district by federal, state and local funding sources. Choose from the menu above the map to select a funding source and use the slide bar to change the school year. Hover over the map to view per pupil expenditures and the percent of per pupil expenditures the source accounts for. Use the graph below the map to view per pupil expenditures for all funding sources for a school district over time. Select a district in the map or use the dropdown menu above the graph to view the district data.
A few observations about the numbers:
- Statewide, total per pupil expenditures ranged from $7,282 to $16,616 in 2013-14.
- Higher per pupil expenditures were in districts in the northeast region of the state, the northern coastal area and in the mountains.
- State funding accounted for the majority of per pupil expenditures for every district except Asheville City and Chapel Hill-Carrboro.
- Hyde and Tyrrell school districts had the highest total and state funded per pupil expenditures in 2013-14.
- Local funding accounted for a higher percentage of total funding in districts along the coast and in city districts including Asheville City and Chapel Hill-Carrboro.
Note the scale changes for the funding sources to provide a better visual presentation of differences in per pupil expenditures statewide.
About the author