This is an excerpt from “E(race)ing Inequities: The State of Racial Equity in North Carolina Public Schools” by the Center for Racial Equity in Education (CREED). Go here to read the full report and to find all content related to the report, including the companion report Deep Rooted.
The SAT is a standardized test intended to assess students’ readiness for college. The test measures mathematics, reading, and writing, and combined scores range between 400-1600. The SAT (along with the ACT) is widely used in college admissions and is required for freshman entry to many colleges and universities. Only high school grades were considered more important by more postsecondary institutions in admissions decisions in 2018 (Clinedinst & Patel, 2019). Over 2.1 million students nationwide took the SAT in 2018 and earned a mean score of 1068 (College Board, 2018).
Non-Asian student groups of color have historically had lower SAT scores than their White and Asian counterparts (Geiser & Studley, 2001; Jencks, 1998; Thernstrom & Thernstrom, 2004). An analysis from 1976 by the College Board revealed that the average score for Black students was 240 points lower than White students. In 2018, the gap was 177 points. This trend continues in the most recent administration of the test (College Board, 2018). Given the persistence of racial differences in scores, and the inability of socioeconomic differences to explain those differences, scholarship has positioned the SAT as racially (and statistically) biased (Freedle, 2003; Santelices & Wilson, 2010). Not surprisingly, the makers of the SAT have vigorously defended the validity of the test (Dorans & Zeller, 2004).
SAT score, particularly in combination with high school grades, has been found to be a substantial predictor of college success (Camara & Echternacht, 2000). However, the SAT is not as useful in predicting the college success of students of color as it is for White students (Fleming, 2013). While the relationship of race/ethnicity and SAT is complex and contested, for the purposes of this report it is worth noting that scholarship often cites unequal K-12 educational environments as a key factor in the persistent presence of racial/ethnic differences in SAT performance (Fleming, 2013; Thomas, 2004).
In North Carolina, recent decades have seen the SAT supplanted by the ACT as the most widely taken test of college readiness. As mentioned elsewhere in this report, North Carolina administers the ACT to all students (free of charge) in the 11th grade. This effectively makes the SAT an optional assessment for students with college aspirations. As such, there is likely self-selection bias in the sample of students that choose to take the SAT in the state. A minimum score of 880 on the SAT (or 17 on the ACT) is required for admission to UNC System colleges and universities.
Methodology
For the purposes of this study, we position SAT (alongside ACT) as an outcome indicator of secondary school academic preparation and college readiness. In the sections that follow, we report cumulative SAT score as a factor of race/ethnicity in a sample of approximately 61,000 students who took the test during the 2016-2017 academic year. We also modeled the predicted SAT score for students based on race/ethnicity while controlling for gender, free/reduced lunch status, language status, special education status, and giftedness.
Analysis
Figure 9.1 shows the mean SAT score by racial/ethnic group.
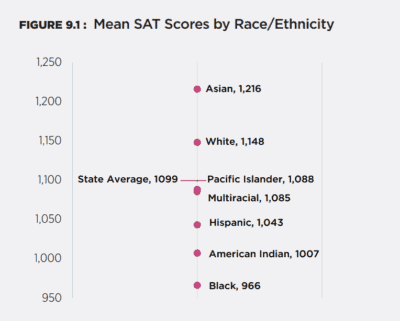
Asian students have the highest mean SAT scores. All non-Asian student groups of color have mean scores below those of Asian and White students and below the state average of 1099. Differences between all student groups of color and their White counterparts are statistically significant (p <.001) with the exception of Pacific Islanders. All student groups score above the UNC System admissions minimum of 880.
In order to isolate the effect of race/ethnicity to the greatest extent possible with the available data, we also built statistical models to predict the influence of race/ethnicity on SAT scores while controlling for other potentially relevant factors. In Model 1, scores were predicted based on race/ethnicity alone. Model 2 controlled for gender, socioeconomic status, language status, special education status, and previous achievement. White students were the comparison group for all other racial/ethnic groups. Figure 9.2 presents the results of both prediction models.
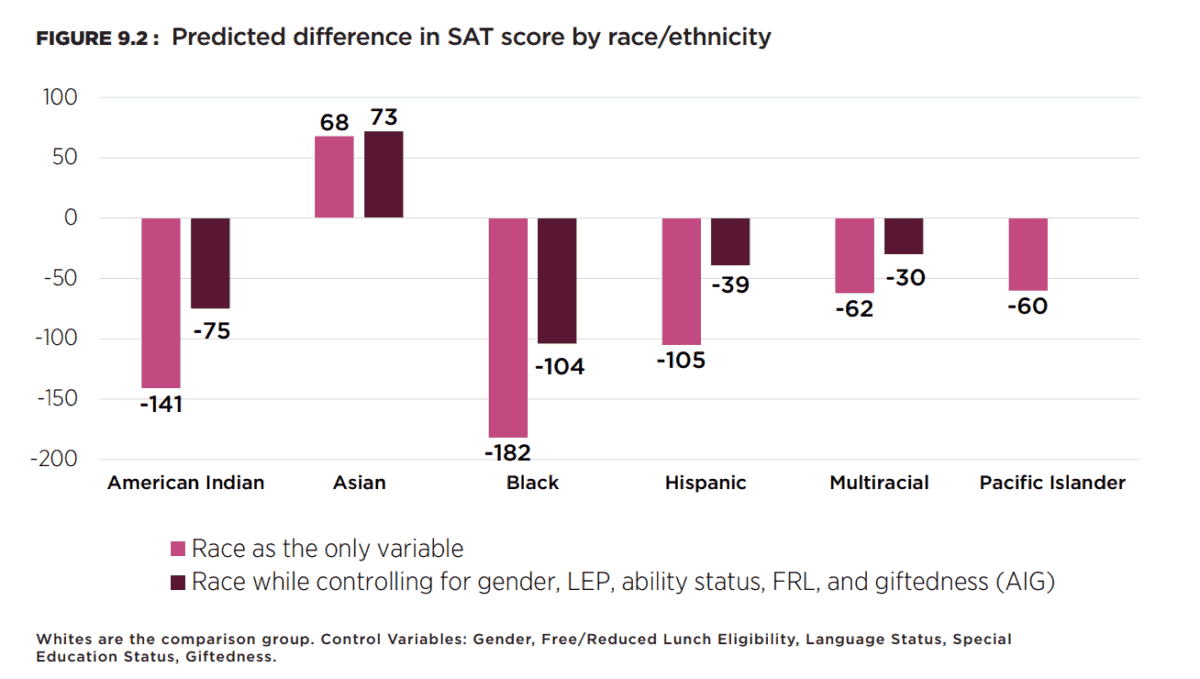
Race/ethnicity remains a significant and substantial predictor for all student groups of color except Pacific Islanders, even after accounting for other factors. Asians were predicted to score 72 points higher than Whites while Black students were predicted to score 104 points lower than Whites net of other factors in the model. Being Black was the strongest predictor of SAT score outside of giftedness.
Takeaways
As was the case with the ACT, we identify clear differences in SAT performance as a factor of race/ethnicity. On average, Asian and White students scored above the state average, and all other student groups of color scored below the state average. Furthermore, race/ethnicity has a significant and substantial effect on SAT scores for all student groups of color as compared to Whites after controlling for other potentially confounding factors. Once again, the results are particularly concerning for American Indian and Black students, who on average score well below other student groups.
To the extent that SAT scores reflect college readiness and given the use of SAT scores in admissions decisions to elite postsecondary institutions, our results suggest that non-Asian students of color may be differentially exposed to educational conditions and contexts that may limit the ability of students to be competitive in the college admissions process. This, in turn, reflects on the relationship between student race/ethnicity and the state’s explicit goals around college and career readiness.
References
Abigail Thernstrom & Stephan Thernstrom. 2004. No Excuses: Closing the Racial Gap in Learning. New York, NY: Simon and Schuster.
Buchmann, C., Condron, D. J., & Roscigno, V. J. (2010). Shadow education, American style: Test preparation, the SAT and college enrollment. Social forces, 89(2), 435-461.
Camara, W. J., & Echternacht, G. (2000). The SAT [R] I and high school grades: Utility in predicting success in college. research notes. New York, NY:College Board
Clinedinst, M., & Patel, P. (2019). 2018 state of college admissions. Arlington, VA: National Association for College Admissions Counselling.
Dorans, N., & Zeller, K. (2004). Examining Freedle’s claims and his proposed solution: Dated data, inappropriate measurement, and incorrect and unfair scoring (Report No. RR-04-26). Princeton, NJ: Educational Testing Service.
Fleming, J. (2002). Who will succeed in college? When the SAT predicts Black students’ performance. The Review of Higher Education, 25(3), 281-296.
Freedle, R. (2003). Correcting the SAT’s ethnic and social-class bias: A method for reestimating SAT scores. Harvard Educational Review, 73(1), 1–44.
Geiser, S., & Studley, W. R. (2002). UC and the SAT: Predictive validity and differential impact of the SAT I and SAT II at the University of California. Educational Assessment, 8(1), 1-26.
Jencks, C. (1998). Racial bias in testing. In C. Jencks & M. Phillips (Eds.), The Black–White test score gap (pp. 55-85). Washington, DC, US: Brookings Institution Press.
Santelices, M. V., & Wilson, M. (2010). Unfair treatment? The case of Freedle, the SAT, and the standardization approach to differential item functioning. Harvard Educational Review, 80(1), 106–133.
The Journal of Blacks in Higher Education. (2015). The widening racial scoring gap on the SAT college admissions test. The Journal of Blacks in Higher Education. Retrieved from http://www.jbhe.com/features/49_college_admissions-test.html
Editor’s note: James Ford is on contract with the N.C. Center for Public Policy Research from 2017-2020 while he leads this statewide study of equity in our schools. Center staff is supporting Ford’s leadership of the study, conducted an independent verification of the data, and edited the reports.