


School performance grades, also known as school report cards, began in 2013 when the General Assembly passed a law mandating each school be assigned a letter grade of A-F based on its performance. Since then, every public school has received an annual letter grade that is calculated based on 80% academic achievement and 20% academic growth.
Low-performing schools are schools that receive a D or an F and do not exceed the state’s growth standards. Schools identified as low-performing are then required to come up with a school improvement plan, although that status does not guarantee extra funding from the state or extra support from the Department of Public Instruction.
Breaking down the grading system
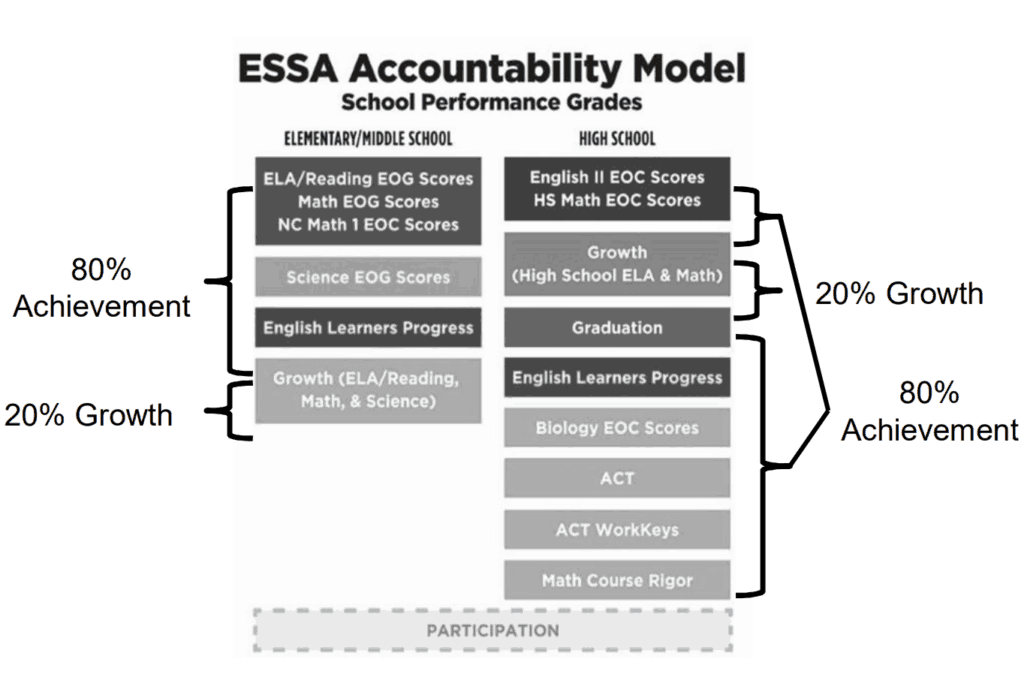
Academic achievement is measured primarily through how students perform on standardized tests. Achievement indicates whether or not a student knows what he or she is supposed to know at any given grade level. While the merits of using standardized testing are debated, nearly 80% of a school’s performance grade is based on the results of end of the year standardized tests. For high schools, student performance on the ACT is also factored into academic achievement.
Academic growth is a bit more complicated to measure. Essentially, it is a measurement of how much the student has learned in a year, not what they learned. In North Carolina, it’s determined by measuring a student’s expected progress for a year against their actual progress. This type of growth metric is called value added, or EVAAS, and eight other states also use this model to measure student growth. For more on the various ways that states measure student growth, click here.
Compiling these two variables for each student in a school with some analytics produces the school’s grade. The following table breaks down exactly where the grades come from.
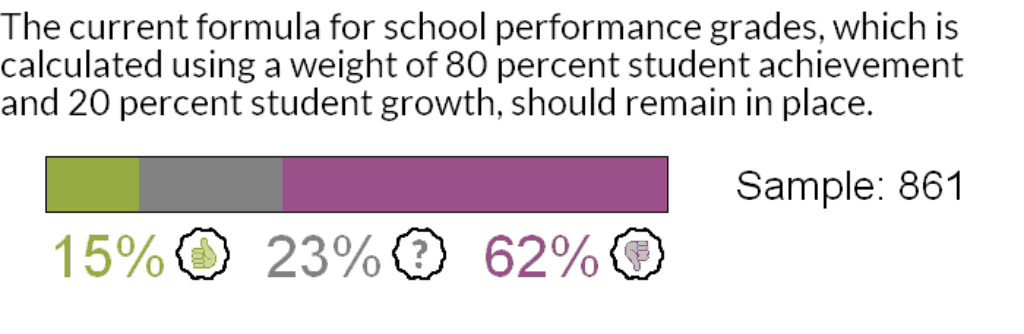
Only 15% of participants in the People’s Session agreed that this formula to measure school performance should remain in place.
Currently, school performance grades are assigned based on a 15-point scale. For example, schools that score anywhere between 85 through 100 are given an A, schools scoring a 70 through 84 are given a B, and so forth. The system is set to change to a 10-point scale next year, but House Bill 362 was introduced to keep the system on its 15-point scale. This is primarily to prevent additional schools from being considered low performing if the scale is reduced to a 10-point scale.
What’s the controversy?
During a recent Reach NC Voices conversation, many North Carolinians expressed concern over the ability of this school performance grading system to take into account the particular needs of Title 1 schools (or other schools with many students who are low income) and students with learning disabilities, and the failure of it to consider teacher metrics in the grade (after all, teachers are a key part of a school, along with the students).
Our colleague Alex Granados wrote this in a 2017 EdExplainer on the grading system:
Much of the controversy over the school performance grades stems from what academic achievement shows. In previous releases of the grades there has been a strong correlation between low school performance grades and poverty. The argument is that in these schools, students arrive disadvantaged and behind grade level. The teachers may be high performing, and the students may be making great strides, but if the students started very far behind grade level, they may have a hard time catching up. In a system that emphasizes academic achievement, a school could receive an F despite the fact that there is a lot of progress in the classroom.
Another argument is that schools with a higher-wealth population will tend to have students with better academic achievement. The students come from families with the means to make sure they succeed. These students may come to school already at grade level or above. As a result, they may score well on tests. Because of this, the school may receive high marks for academic achievement and a corresponding successful school performance grade. This could happen irrespective of whether the students are showing academic growth beyond their initial achievement level.
Those who argue for the importance of academic achievement say that this is the measure that shows whether students know what they are supposed to know.
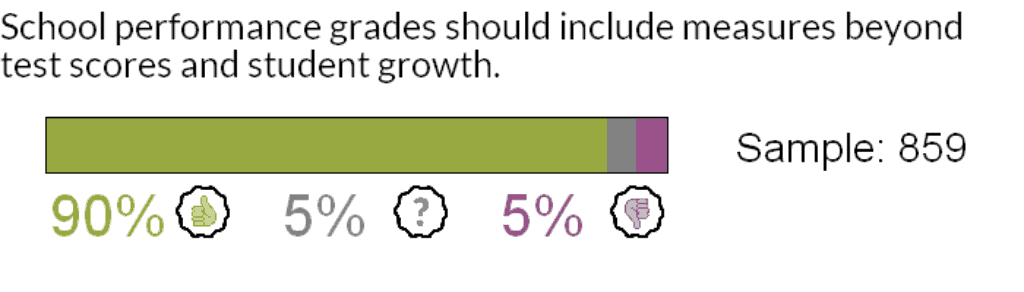
A whopping 90% of People’s Session participants believe that a school’s performance grade should include metrics beyond just student achievement and student growth.
“School performance grades are insufficient in using such little input. Beyond academic and growth inputs there should be inputs for context base of the students, how parents are involved in the lives of students and the school, and community support beyond tax dollars for each student in the classroom.” — Pitt County
Additionally, many of our readers have mentioned the grades should not be made public at all. Some see the grades as a tool used to stigmatize schools with large lower-income populations that allow parents to shop around for different schools and further polarizes student bodies across school districts.
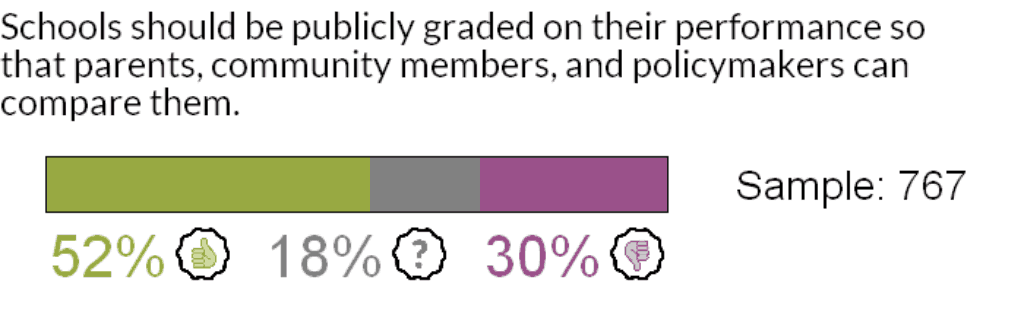
Participants were a bit more mixed here, with 52% agreeing that the performance grades should be made public and 30% feeling they should not be made public.
“I think they should be used as an internal tool for improvement. Many industries use metrics to measure how effective and efficient they are but those are not made public. I don’t know what should be released or made public, but I believe the current way places a stigma on these schools.” — Anonymous
In the legislature
Our senior reporter, Alex Granados, has been closely following new bills on school performance grades in our current general session. On March 27, 2019 the House voted through two bills affecting school performance. The first, House Bill 354, would change the percentage of grades from the current 80% student achievement and 20% student growth to an evenly split 50/50 of both metrics. The second, House Bill 266, would actually establish two separate grades — one for student achievement and one for student growth. These bills have now been passed on to the Senate for review.
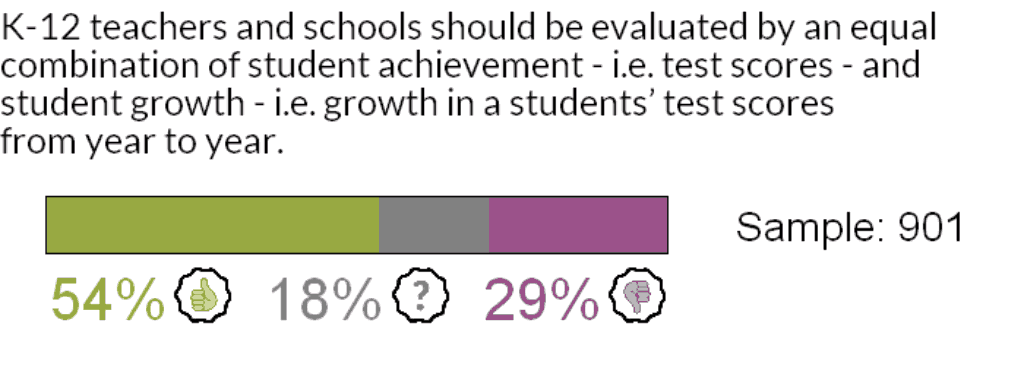
Interestingly, 54% of People’s Session participants agreed with an evenly split school grading formula of student achievement and student growth and 29% disagreed with this even split.
The People’s verdict
A majority of participants in the People’s Session indicated that they are ready for a change to the school performance grading system. As shown below, only 15% of North Carolinians believed that the current system should remain in place.
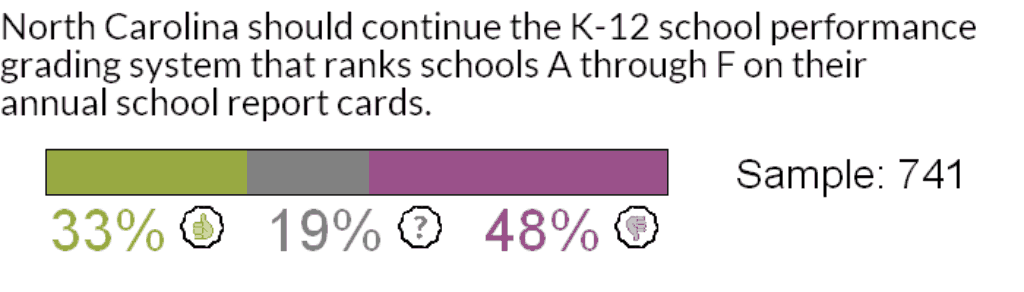
Taking it a step further, only 33% believed we should continue to grade schools performance at all.
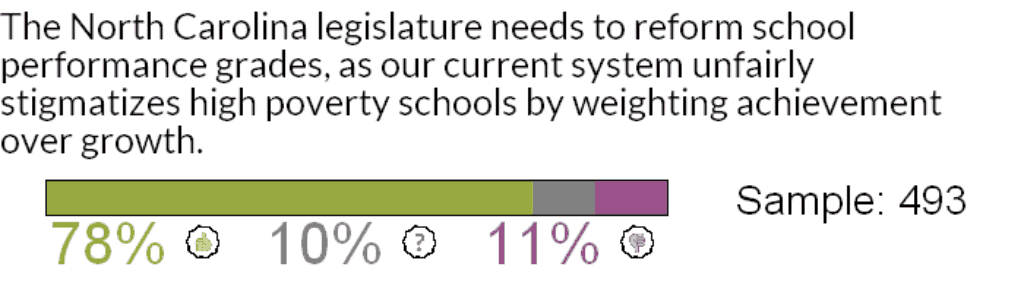
And when asked if the legislature needs to reform school performance grades because they unfairly stigmatized high poverty schools, 78% agreed.
“Schools in more affluent areas have so many advantages over lower SES schools. Schools with high-achieving students are not going to see the same amount of growth because there is not as much room to move at the top ends. Whereas, with limited resources, the schools in lower SES areas don’t get credit for big movements in scores either.” — Wake County
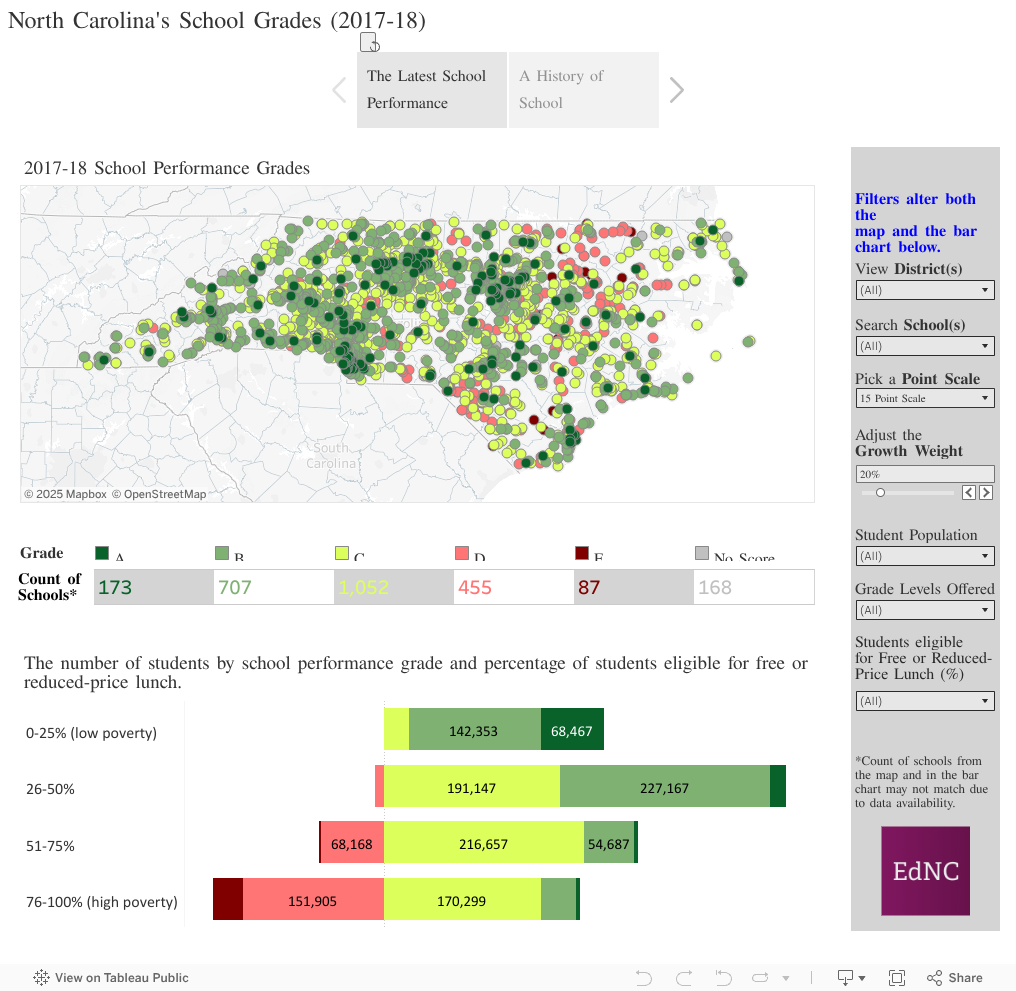
If you’ve ever wondered what the school performance grades would look like under different scenarios, we have a map for that. The interactive map below allows you to adjust the point scale and growth weight for school performance grades at the school and district level. You can go a step further by filtering the grades by the school’s student population, grade levels offered, and percent of students eligible for free- and reduced-priced lunch.
Still confused about school performance grades? Here’s our EdExplainer that breaks down the topic a little further.
For a closer look at what people said about school performance grades and other key education issues, read our full People’s Session report.
Want to weigh in on the debate? Give us your comments on our Reach survey below.