

Editor’s note: This is the fifth in a six-part series on the Durham Public Schools that originally appeared at the Bull City Rising Blog. The articles are reprinted here with authors’ permission.
Over the last two days, we’ve seen that DPS’s position of financial strength seems unbalanced in its uses within the system.
For instance, comparatively little of the district’s extra spending on instructional programs goes to the use of regular classrooms, with alternative/special population programs and administrative costs taking a much greater cut. And, DPS’s administrative costs well outrank the three school systems closest to DPS in size.
Today’s we’re going to drill in further to an analysis of classroom and school-level instructional resources — since most people seem to agree that teachers and principals are the most essential and consequential individuals in a school system, it’s crucial to understand where DPS is resourced at the individual school level.
In the context of the student achievement crisis discussed in the first post in this series, today we’ll explore the following questions:
- Does DPS prioritize classroom teachers?
- Do high-needs schools in DPS have more teachers?
- Is teacher and principal compensation sufficient to attract and retain high quality educators and school leaders?
Although many external factors affect student learning, an adequately staffed force of high-quality professional teachers supported by strong school-based leaders is the foundation a school system needs to provide a sound education for all students.
In some ways, particularly around socioeconomic allocation of resources, DPS seems relatively well balanced.
Yet some of DPS’s other decisions — on elementary vs. secondary school teaching resources, allocation of per-pupil local teacher funding at some high schools, and principal/assistant principal supplemental funding and staffing levels — defy as easy an explanation and are worth further scrutiny.
Districtwide teacher allotment
The state provides funding for teachers using per-pupil allotment formulas. If districts believe they need additional teachers, they can use local dollars to fund additional positions.
DPS and the state hire, allocate and fund teachers across a range of categories. The largest covers so-called regular classroom teachers, a count that excludes exceptional children, AIG, limited English proficiency and other programs. For comparative purposes, the analysis below focuses only on regular classroom teachers using 2015-16 data.
DPS allocates 847 positions to elementary school teachers, 327 middle school teachers, and 426 high school teachers. (An additional 114 teachers are assigned to DPS’s two grade 6-12 schools, Durham School of the Arts and the School of Creative Studies.)
All told, this represents 847 elementary teachers, vs. 867 secondary school teachers.
Which seems like a reasonable division — until you look at the state’s formula for funding teachers, versus DPS’ allocation of its local-choice dollars.
Just by the state’s formula alone, DPS receives funding for 853 elementary teachers.
On the other hand, middle and high school programs have 193 more teaching positions than the 674 that are funded by the state. The remaining teachers appear to mainly be funded through local spending allocation.
Is it possible that the state allotment for elementary school teachers is sufficient for Durham’s needs? That does not appear to be the case given the disparity in early testing results between DPS and the rest of the state. (As we mentioned in Tuesday’s post, despite the reservations we have about the quality and appropriateness of state tests, they do provide a tool to directly compare performance between school districts.)
End of grade (EOG) exams in math, english, and science results for DPS elementary schools find the most common EOG score to be a 1 on a 1-5 scale — with one being the lowest score. Statewide, a 4 is the most common score.
This isn’t to say that the extra teaching positions allocated to secondary grade programs aren’t needed; nor do these data include AIG, EC and other programs or instructor work time. Still, it would seem worth further analysis as to whether DPS elementary schools could use additional classroom resources as well. (This disparity is one of the areas where we’d welcome more information from DPS — and more consideration during upcoming budget processes.)
On a brighter note, thanks to tiered funding at the elementary level, schools with high proportions of economically disadvantaged students typically receive more local teacher funding than lower-poverty schools. As the scatterplot below shows, typically elementary schools’ per-pupil additional local teacher funding increases relatively linearly with the free and reduced lunch qualifying rate in the school.
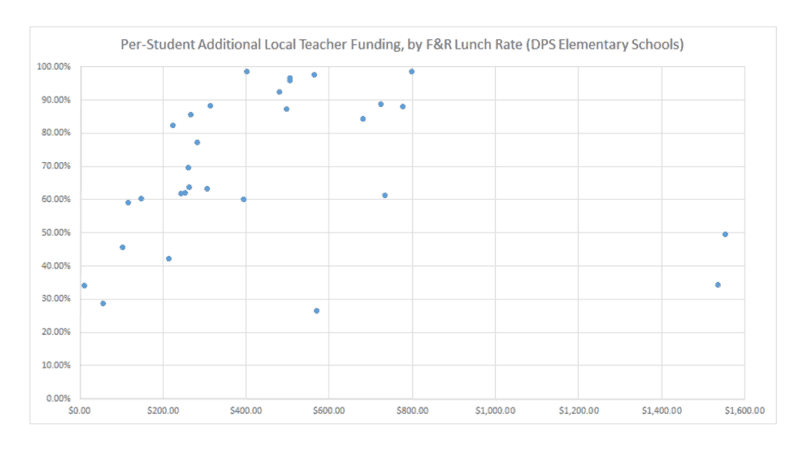
(The two exceptions, at the right side of the graph, are Watts and Morehead, Durham’s two Montessori magnet schools; however, we assume this is due to the presence of Pre-K programs at these, the only two DPS schools with such programs. While this is a reasonable explanation, further analysis would be ideal to ensure there’s not an equity issue with schools that have seen fairly rapid increases in student SES/wealth levels in recent years. No other elementary schools come close to this level of additional local investment, including those where over 90% of students qualify for free and reduced lunch — but, it’s not clear that the data source for the above graph includes programs like Head Start, pre-K options for EC students, etc.)
Again to DPS’s credit, at the middle school and high school level, by and large, schools with higher levels of poverty receive more local teacher funding. Again, however, two outliers are worth mentioning:
- The first is DSA, another a magnet school that attracts students whose parents may otherwise have left the district. Of the six major high schools in DPS, DSA has the lowest proportion of economically disadvantaged students, but receives an additional $350 per-pupil in local teacher funding over Southern, the lowest-wealth high school, another disparity worthy of further analysis.
- The second outlier is Hillside, the beneficiary of a substantial federal school improvement grant from 2009 to 2014 that provided additional funding to the school. DPS picked up the tab at grant’s end, spending $1,353 in local per pupil funding on additional teachers above the state allotment. Given existing and increasing economic and academic challenges at Southern, Northern and even Riverside, this is another gap worth watching.
The additional costs of magnet schools may extend beyond the classroom as well. Among the 20 largest districts in the state, DPS has by far the highest per pupil cost for student transportation, $7.5 million more on average than its peer districts.
While we don’t know for sure that magnets are the driver of this, it is surprising given that among the 20 most-populated counties, Durham’s has the smallest geography (298 square miles.) We’d expect to see DPS’s transportation cost scrutinized not just for the general inefficiencies noted earlier in the series, but also to understand to what extent the presence of nearly two dozen magnets contributes to this cost.
Principal and teacher compensation and turnover
Local salary supplements are a tool the district has to attract and retain high quality staff. Although many factors affect turnover, none is more straightforward than pay. This is a lever that DPS pulls very hard, but the efficacy is difficult to judge.
The local principal salary supplement is the highest among all 115 districts in the state. It is over $4,000 more than the next highest local supplement, and over $20,000 more than the state average.
Perhaps as a result, principal turnover in DPS is below the state average. In the 2014-15 school year, DPS had 5% principal turnover rate compared to a 10% state average.
Another striking datapoint lies in spending on assistant principals. DPS is allocated state funding for 33.1 assistant principals. Durham adds funding for 47.0 additional positions, for a total of 80 assistant principals. Including benefits, this costs $5.3 million in additional funding — nearly $155 per enrolled pupil this school year (or about 1.5% of the total per-pupil educational cost.)
While DPS funds teachers at rates above state averages, unlike full-rank principals, the turnover story is a very different matter.
Statewide, DPS has the 4th highest average local teacher salary supplement in 2014-15, at $5,494[2]. (Chapel-Hill/Carrboro had the highest local supplement in 2014/15 at $6,892; the state average was $3,689.)
In the 2014-15 school year, DPS had a teacher turnover rate of 20.4%, which is the highest among the 25 largest districts in the state[3]. And, out of all of North Carolina’s 115 districts, DPS has the 10th highest five-year average teacher turnover rate, at 19.4%.
One might expect a strong negative correlation between the local teacher supplement and teacher turnover; districts with high local supplements might be expected to have low teacher turnover and vice versa, for instance. This does not play out when comparing DPS to other North Carolina districts, perhaps because even the highest teacher salaries in North Carolina are lower than salaries in nearly all other states.
To bring DPS teacher pay up to the national average, DPS would need to boost teacher pay by an additional $8,000 or so. Assuming the state continues its current funding levels, this would cost Durham County taxpayers about $20 million annually in salary alone.
That sounds like a staggering expense — yet, we should keep in mind, it’s just about equivalent to the premium Durham spends on central administrative support resources relative to our peer counties (Gaston, Cabarrus, and Johnston.)
Source data: