

Editor’s note: This is the second in a six-part series on the Durham Public Schools that originally appeared at the Bull City Rising Blog. The articles are reprinted here with authors’ permission.
First up: how does Durham’s academic performance compare against its peers?
The short answer isn’t comforting. If you’re white, the answer seems to be that you’ll do just fine — if you’re not, you’re literally at the bottom of the pack.
Before we go there, let’s look first at the aggregate data.
With over 33,000 students, Durham is the eighth-largest school district in the state. For a starting point, it’s useful to look at the ways in which DPS’ performance compares among the ten largest N.C. school districts.
Naturally, such an analysis depends on standardized test results from NC DPI. There’s plenty of reason to be worried about the testing-heavy regimes in school districts throughout the country, including in Durham, and some will argue this is a poor benchmark for learning achievement.
We’ve got a hunch this is not the method that DPS would choose to measure its performance by. In fact, based on the district’s response to the last round of test results, we’re pretty sure it isn’t.
Looking at school performance through a slightly different lens, the state uses complex statistical algorithms developed by SAS to measure growth for individual students and schools. After N.C. DPI found 21 out of 53 DPS schools to be “low-performing” earlier this year, the district countered that 14 of these schools met the their yearly growth metrics, and that the “school performance grades do not accurately reflect the teaching and learning going on in each school.” (Of course, even among the schools that met or exceeded targeted growth from 2013-14 to 2014-15, half of them saw actual pass rates decline.)
There are good arguments on both sides of the question of school growth measures, and about standardized testing overall, but we think it’s worth stepping back and looking at the tests in a different light: what do they tell us about how Durham students perform relative to others in the state?
After all, the biases and failings in the test do not merely affect DPS students; they are also faced by students in every other North Carolina school. In this report, we want to see how DPS students perform relative to students in other districts.
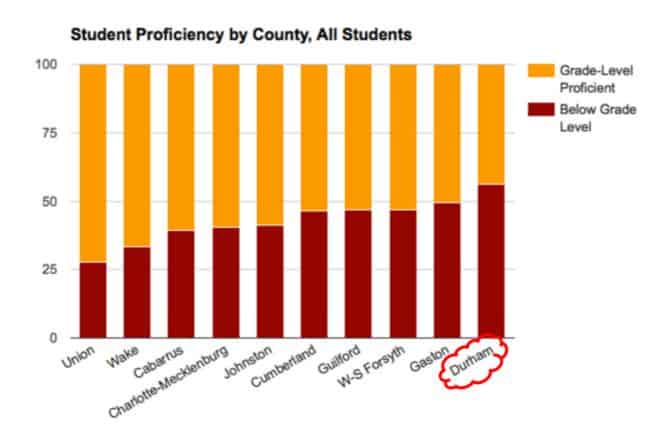
It turns out that when you use comparative data, be it achievement of grade level proficiency (GLP) or college and career readiness (CCR) — the two testing metrics used by the state — DPS falls at the bottom of every ranking but one:
- Overall GLP and CCR rates: 10th out of 10
- Hispanic students: 10th out of 10 (GLP)
- Economically disadvantaged students: 10th out of 10 (GLP)
- Students with disabilities: 10th out of 10 (GLP)
- African-American students: 9th out of 10 (GLP)
- White students: 4th out of 10 (GLP)
Indeed, DPS is the only district out of N.C.’s ten largest systems where fewer than half of its students met GLP in 2014-15.
The counterargument, it may be said, is that the ten largest districts do not necessarily match DPS on demographics. Union is a fast-growing, suburbanized areas with higher-SES new residents; Wake has massive high-wealth areas where students perform well; etc.
Okay. Let’s go to a different metric — how does DPS rank among all 115 public school districts in the state? Next verse, somehow worse than the first:
- Overall GLP rates: 93rd out of 115
- Overall CCR rates: 89th out of 115
- Hispanic students: 105th out of 115 (GLP and CCR)
- Economically disadvantaged students: 105th out of 115 (GLP), 103nd out of 115 (CCR)
- African-American students: 60th out of 115 (GLP), 58th out of 115 (CCR)
- White students: 8th out of 115 (GLP), 6th out of 115 (CCR)
The contrast is, if anything, more extraordinary against the larger comparison sets. White students’ achievement on standardized tests is nearly the best in the entire state — yet Latino students fare worse in Durham than nearly any other district.
Selection biases may play a role. For instance, the Durham MSA’s high ranking on economic inequality likely means that there are a disproportionate number of highly-educated and -compensated white families in Durham; that those who send their kids to public schools are likely to see their children excel anywhere in the state; that the performance data would look different if so many parents of means did not send kids to charter or private schools.
Only problem is, none of that moves DPS or our county one iota closer to fulfilling the basic constitutional right of all persons under North Carolina’s system of law: equal access to a high-quality primary and secondary education.
Income inequality raises still another explanation or rationalization — pick your lens — on the data, of course.
Is it fair to compare DPS to only large districts, or to all districts, instead of drilling into those districts that are high-poverty?
(Spoiler alert: the data are dismal any way you slice them. But let’s proceed.)
DPS in 2014-15 saw nearly two-thirds of its students qualify for the federal free/reduced lunch program. Within the state, there were 48 out of 115 districts with the same or greater levels of poverty. Against just that comparison set, DPS still was below-average:
- Overall GLP and CCR rates: 31st and 28th out of 48 respectively
Most of the districts performing worse than DPS in this measure have a F&R lunch eligibility rate at least 10% higher than DPS.
The bottom line?
Only 44% of DPS students are grade level proficient (GLP) and 35% meet college and career ready (CCR) standards. The data is relatively consistent across the elementary, middle, and high school levels.
Furthermore, large achievement gaps exist, both by race/ethnicity and by class. While 70% of white students in DPS meet CCR standards, the same holds for only 25% of black students, 26% of hispanic students, and 22% of economically disadvantaged students.
(It’s important to note that 76% of DPS students are either black or hispanic, and nearly two-thirds of DPS students are economically disadvantaged.)
In the measures related to non-white students, DPS performs worse than all the other large districts in the state; very poorly relative to all 115 systems; and worse than most districts facing equal or higher levels of poverty.
There’s one area where we lead all other districts, though: we spend more in local supplemental dollars than any of the other large districts in the state.
And, compared to those large districts most alike to DPS, we spend as much as $120 million more — only to achieve poorer results.
It may be, as current school board chair and County Commission candidate Heidi Carter said, that our district is trying to struggle upwards at least to the average level of support schools get nationally, since North Carolina is (both recently and for years under previous Democratic leadership) a laggard in primary/secondary education funding.
Yet if we’re spending more per pupil than other districts in the state — even those districts that resemble Durham as large, urban programs — why are we lagging so far behind?
Source data:
- Download NC LEA Academic Performance Drilldown — This file, from NC DPI data for 2014-15, ranks DPS against other districts for CCR/GLP on a range of demographic bases.
- Download NC LEA EDS vs GLP — This second spreadsheet compares academic performance to free and reduced lunch (F&RL) qualifying rates.