My map-making process sometimes starts with a question based on research or current events, followed by a search for data that supports the answer to that question. Less frequently, data comes across my desk that fits my current work and is perfect for mapping. The most common scenario for me, however, is when other work leads me to a vast body of data that I never knew existed. Many times, I know I can map and visualize this data, but before I do, I need to spend some time thinking about why it’s of value.
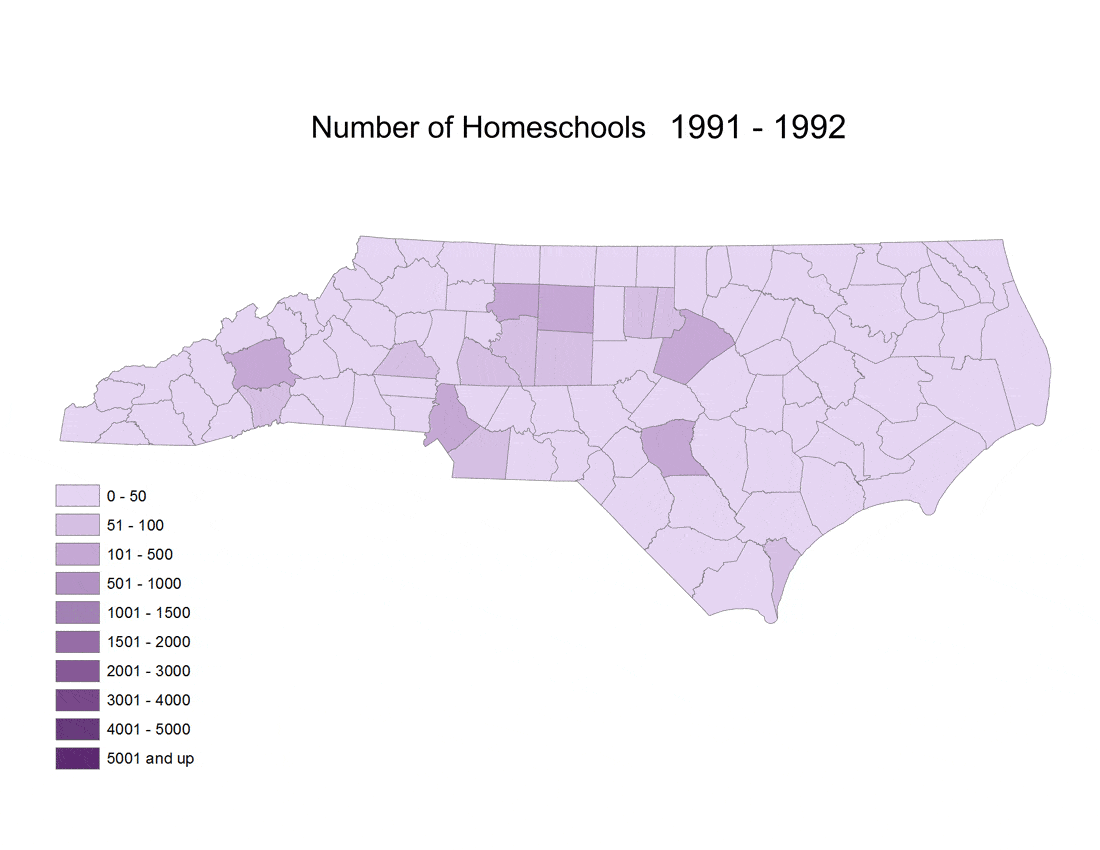
That’s how I felt when I looked at the homeschool data provided by the North Carolina Division of Non-Public Education earlier this month. I knew that the number of homeschools and estimated student enrollment were ripe for a map that shows changes in enrollment over time, but I had to work to formulate the questions – why is this information interesting and important?
If you’ve been following EdNC’s coverage about homeschooling this year, you already know that homeschooling is on the rise and becoming part of the state conversation about education like never before. Beyond the research and commentary presented on EdNC, I also read a number of articles and blogs from other sources to try to wrap my head around not only the numerical trends but also some of the reasoning behind a family’s decision to homeschool. For example, this article in New York Magazine from 2012 looks at the practice from multiple angles, and this blog gave me a taste of what proponents are saying. The total number of reasons why parents elect to instruct their children at home is vast, but there appear to be at least a few that are more commonly held than others, including:
- Family religious beliefs that don’t align with public school curricula
- Non-religious concerns about curriculum content, such as Common Core
- Desire for flexibility to offer learning tailored to the student and pace of a child’s learning
- Medical issues, such as learning disabilities or severe food allergies
- Concerns about school environment, such as bullying and overcrowding
The rapidly-growing availability of online support and resources for homeschooling also undoubtedly has contributed to the increase in enrollment.
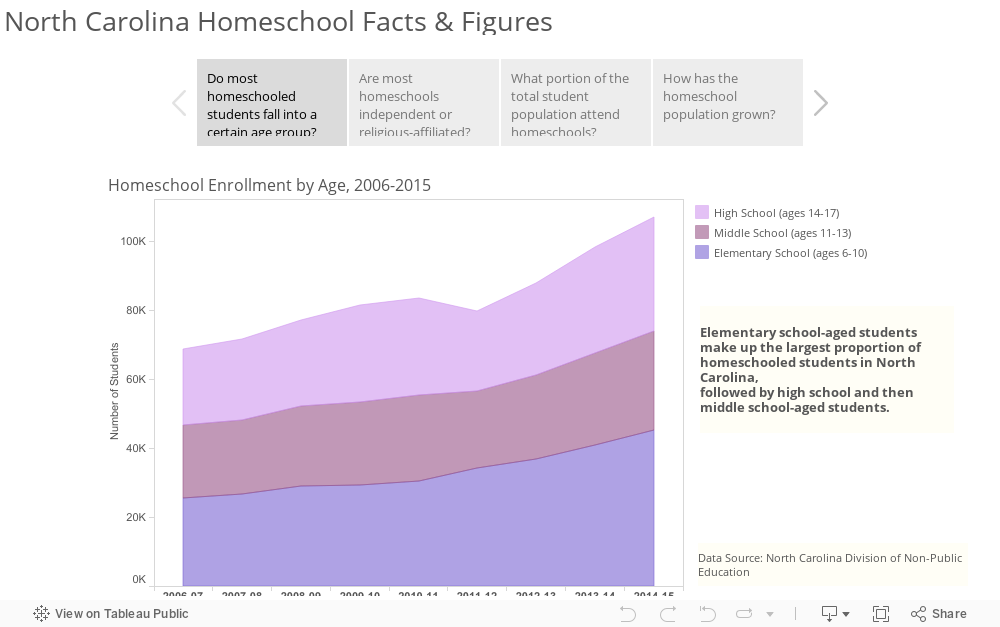
Learning more about the decision to homeschool gave me context and helped me formulate questions about the data that I have on hand. I became interested in the distribution of registered homeschools across the state, as well as in some of the breakdowns that are possible with the data: Are there times in the past 20 years when homeschooling was more or less popular, or has the enrollment increase been steady? Do parents mostly opt for homeschooling for religious reasons, or are some of the other reasons listed above just as important to them? Are most homeschooled students elementary age, or are they older? How do homeschool populations compare with populations enrolled in traditional, charter, and private schools?
Fortunately, I can answer most of these questions with the data available, giving me a more well-rounded view of the story behind homeschooling and its rise. I really enjoy this kind of data analysis – starting with the data and figuring out how it fits into the broader narrative about education. Too often, I think we tend to look at quantitative and qualitative data separately rather than taking the time to bring them together to understand the full story. I hope we can use the mix of data incorporated into this month’s map—the whys, the hows, and the raw numbers—to help inform the dialogue about homeschooling and further the conversation.
Are there aspects of homeschooling that you would like to know more about? Let us know!
About the author