
This is the first piece in a week-long series on schools, districts, and organizations across the state using data in innovative ways. Follow along with the rest of the series here.
At Shamrock Gardens Elementary School in Charlotte, everyone in the building — the students, the teachers, the custodial staff — can recite the school’s three goals.
- Create a culture of care
- Instill a love of literacy
- Utilize data-driven instruction
Every meeting at the school, whether it’s a student support meeting or a literacy intervention meeting, starts with these three goals in mind. You’ll find them incorporated in the school’s improvement plan and hanging on the walls of Principal Sarah Reeves’ office. And, according to Reeves, even the order of the goals has a purpose.
When Reeves first arrived at Shamrock Gardens Elementary in 2014, she heard data-driven instruction (DDI) discussed in a negative light — but that wasn’t her experience with the practice at previous schools.
“I felt like I was able to really close achievement gaps for kids. I was able to customize and tailor my instruction to meet their needs. In the school where I had come from, it was a really positive thing,” said Reeves. “A lot of my initial conversations were like: ‘We’re beating teachers over the head with data, we’re multiple choice-testing kids to death.’ It was almost like as soon as you said DDI, people said: ‘Why is that the only thing driving instruction?'”
Shamrock Gardens Elementary
– District: Charlotte-Mecklenburg Schools
– Enrollment: 548 students
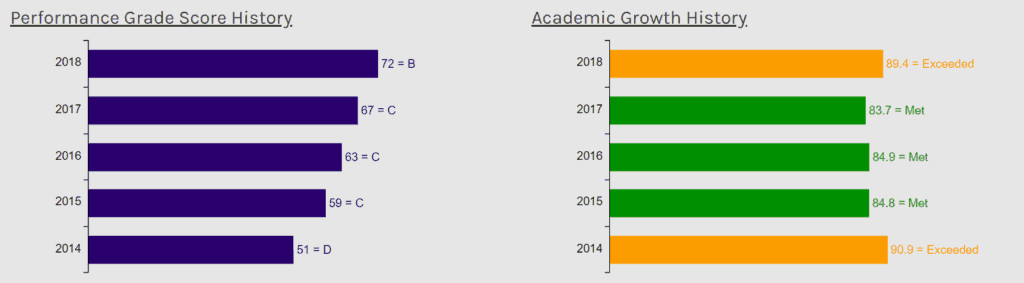
– Performance: Exceeded growth in 2018 after meeting growth for the previous three years
– 48.8% of students are economically disadvantaged
Through those conversations with teachers, Reeves realized it wasn’t actually the DDI that teachers were frustrated with, but rather the thought that data and numbers were overtaking everything else at the expense of considering the whole child. That’s when she decided it was time to step back from an emphasis on DDI to first address the school’s culture.
“I had a lot of wise mentors tell me: You can’t do anything well and expect your data to soar unless you first focus on a strong culture within your staff, you reduce teacher turnover, you make your school be a great place to teach and learn,” said Reeves. “And once you do that, and then you begin to implement best practices in data-driven instruction, that is truly where the shift happens — not only for a short peak of one or two years, but a continued upward slope.”

Creating a culture of care
Shamrock Gardens Elementary has seen tremendous growth over the last five years. In 2014, the school received a D performance grade despite exceeding growth. For the next four years, the school continued to meet growth, and raised its grade to a C in 2015-2017 and a B in 2018.
For Reeves, this steady growth is a testament to the fact that the school didn’t go after data-driven instruction right away. Rather than chase numbers and metrics, the school slowed down and focused on the culture, health, and wellbeing of the teachers and students.
“I sat down and listened to the teachers to hear: What is it going to take for you to love what you do every day and love coming to school?” said Reeves. “There were some people that the passion was already there, but there were others that felt defeated by this mentality of, ‘Let me put your data up on a projector in the middle of a staff meeting and talk about what we need to do differently.'”
Another part of establishing a culture of care was shifting teachers’ mindsets around the role of data from defining a teacher’s quality or a student’s worth to being used as a tool to improve student outcomes. Since teachers are assessed by their EVAAS scores, Reeves said she often had to send a counter-intuitive message to her staff: While their focus needed to remain on urgency, efficiency, and being the best educators possible, one test did not define their quality.
“I’ve heard leaders say that teachers need to be concerned if their data looks a certain way. It’s the polar opposite culture at Shamrock, where I’m saying it’s one test, it’s okay, we will get there,” said Reeves.
“You have to focus on the instructional culture of your school before DDI can be done effectively. I think that’s a common, easy pitfall that leaders make is they go right after that DDI and right after the systems and structures and, as a result, there’s a lot of unintended consequences that come from that mentality.”

Using data to drive instruction
In Reeves’ third year at the school, the time was right to dive into data-driven instruction. Previously, teachers were looking at the data, identifying what kids needed, understanding where the gaps were — and that’s where the process ended. Reeves spent time with the teachers on the importance of extending that data-driven practice: once gaps are identified, a plan is created, that plan is practiced, and that plan is followed up on.
“You could crunch numbers for days, but it’s about what you’re doing to respond to that data that’s the most important part,” said Reeves.
Teachers learned how to read Measures of Academic Progress (MAP) reports, identify students in different percentiles, disaggregate data by subgroups, and more.
At the end of that year, Reeves spent a summer in the Relay Graduate School of Education where she had an ‘aha’ moment: she’d been looking at the data all wrong. When Reeves was first trained on DDI, she was taught to use common interim assessments, create six-week plans to reteach the standards, and then reassess.
“There was this whole new concept that you look at data every week or two, and as opposed to just looking at the numbers, you physically take out the student work samples and you do work sample analysis,” said Reeves.
While disaggregating the common interim assessment data allowed teachers to identify and target what students needed to relearn, that data never actually told the teachers what the students’ misconceptions were.
“We might say they chose B, but B was the distractor, and we need to go back and teach this again. But it was never about: let’s figure out how this kid solved this problem, and oh my gosh they flipped their 6 and their 2 and that’s why this whole problem is wrong,” she said.
Weekly data meetings
When Reeves returned to Shamrock Gardens after that summer, she brought the concept of weekly data meetings with her. In addition to administering common interim assessments four times a year to track student data, teachers began to use “checkpoints” throughout the school year where they collected authentic student work samples. These checkpoints tend to be open-ended rather than multiple choice, allowing teachers to glean where misconceptions are happening.
“I’m convinced that’s why we made the growth that we made. We really soared last year. It’s where the rubber met the road, and we just took off,” said Reeves. “There’s just a lot of power in the teachers learning and understanding the standards better, but also understanding where the student misconceptions lie and actually teaching to that rather than, okay, I have to reteach this standard because we only have this percent mastery.”
Data meetings are held every other week depending on subject area. During the meetings, teachers review examples of high, medium, and low student work samples of a particular question that a majority of students struggled with from a previous checkpoint.
They discuss the most common misconception within that question and map out how they will teach their students to fix that misconception. Then, teachers have the chance to practice reteaching that standard in front of their colleagues, giving them a chance to garner feedback before taking it back to the classroom.
If this process sounds time-intensive, it is. But all of this is accomplished during the teacher’s 55 minute planning period.
Some people say: You spend 55 minutes on one lesson?” said Reeves. “But my argument to that is, if it’s a power standard and it’s a true misconception that a majority of the grade level grappled with, what better thing to spend 55 minutes on than the most needed standard to be re-taught?”

Beyond test scores: Surveys, social-emotional data, and chronic absenteeism
While common interim assessments and checkpoints supply the school’s data on student achievement, the focus on data doesn’t end there. Remember the school’s first goal? Create a culture of care. To ensure the school got this right, Reeves decided to incorporate it into the school improvement plan. But, to do that, she first had to find a quantifiable way to measure culture.
While state and district-level parent surveys exist, Reeves wasn’t getting the answers she needed in an actionable time frame, so she decided to implement parent surveying in-house. The questions in the survey depend on what the school wants to know that year.
“If it’s instilling a love of literacy, why don’t we ask our parents: Does your child love to read at home? Or, if it was creating a culture of care, why don’t we ask our parents: Does your child feel like someone at school cares about them and knows who they are as a person, or knows something about them outside of school?” said Reeves.
Once Reeves saw the success of parent surveys, she implemented similar mechanisms for students and teachers, allowing them to share feedback using surveys. Through Google Forms, students provide feedback to their teachers. Then, teachers disaggregate the data and identify what they will keep doing, where they will grow, and what their action steps are to achieve that growth.
These surveys are administered to students twice a year — once in October and once in March — allowing time for teachers to act on the results. Professional development plans in teacher evaluations are also aligned to these surveys. Now, the culture of care at Shamrock Gardens is quantifiable.
“The pitfall is we talk more about academics because that’s the thing we have the tangible hold on. But if we actually have a tangible hold on the culture, and we have actual feedback that says we need to fix blank, blank, and blank, we can talk about that just as much as we can talk about the academics,” said Reeves. “And I think teachers really like it because we can look at data-driven instruction in a whole child sense — it doesn’t just have to be academics.”

Data on the whole child doesn’t end with surveys. This year, Shamrock Gardens opted-in to a district pilot with Panorama, a student survey that assigns scores based on social-emotional wellbeing and provides teachers with actionable data that can be used to customize and tailor character education and social-emotional lessons.
And, another part of measuring the culture of care at Shamrock Gardens is tracking and addressing student chronic absenteeism rates. At the beginning of the year, parents sign learning compacts acknowledging the importance of sending their child to school. Then, at the beginning of every month, students take home letters that they have to get their parents to sign and return that list how many days they’ve missed and how that compares to the average student at Shamrock Gardens.
While Reeves acknowledges that chronic absenteeism is a difficult issue to tackle since it’s often correlated with socioeconomic status, the school has seen a 1.5% decrease in its chronic absenteeism rate.
“If kids love learning and know that an adult cares about them at school, they’ll want to come. I have a fourth grader who wakes himself up and walks to school every day. He wasn’t here yesterday, and I met him first thing at the door and said: ‘I missed you, where were you yesterday?'” said Reeves. “So it’s just building those relationships and getting kids to know when you’re not here, you’re missed, and we notice.”

When asked what advice she would give other school leaders working to implement data-driven practices, Reeves emphasized the importance of transparency and aligning the work to the vision and mission of the school.
“It’s very easy to get overwhelmed with data. It’s very hard to understand — with all of these numbers coming in — how do I prioritize and actually put some tangible things into action to move the dial?” said Reeves. “Because we’ve been so clear, it really does streamline the process for everyone and build a lot of investment and buy in from the whole team. If I’m a week late in delivering feedback, I get emails that say, ‘Hey, I want to know my survey data!’ That’s truly the success — when you have buy in from your staff.”